


 9 / 22

page 9
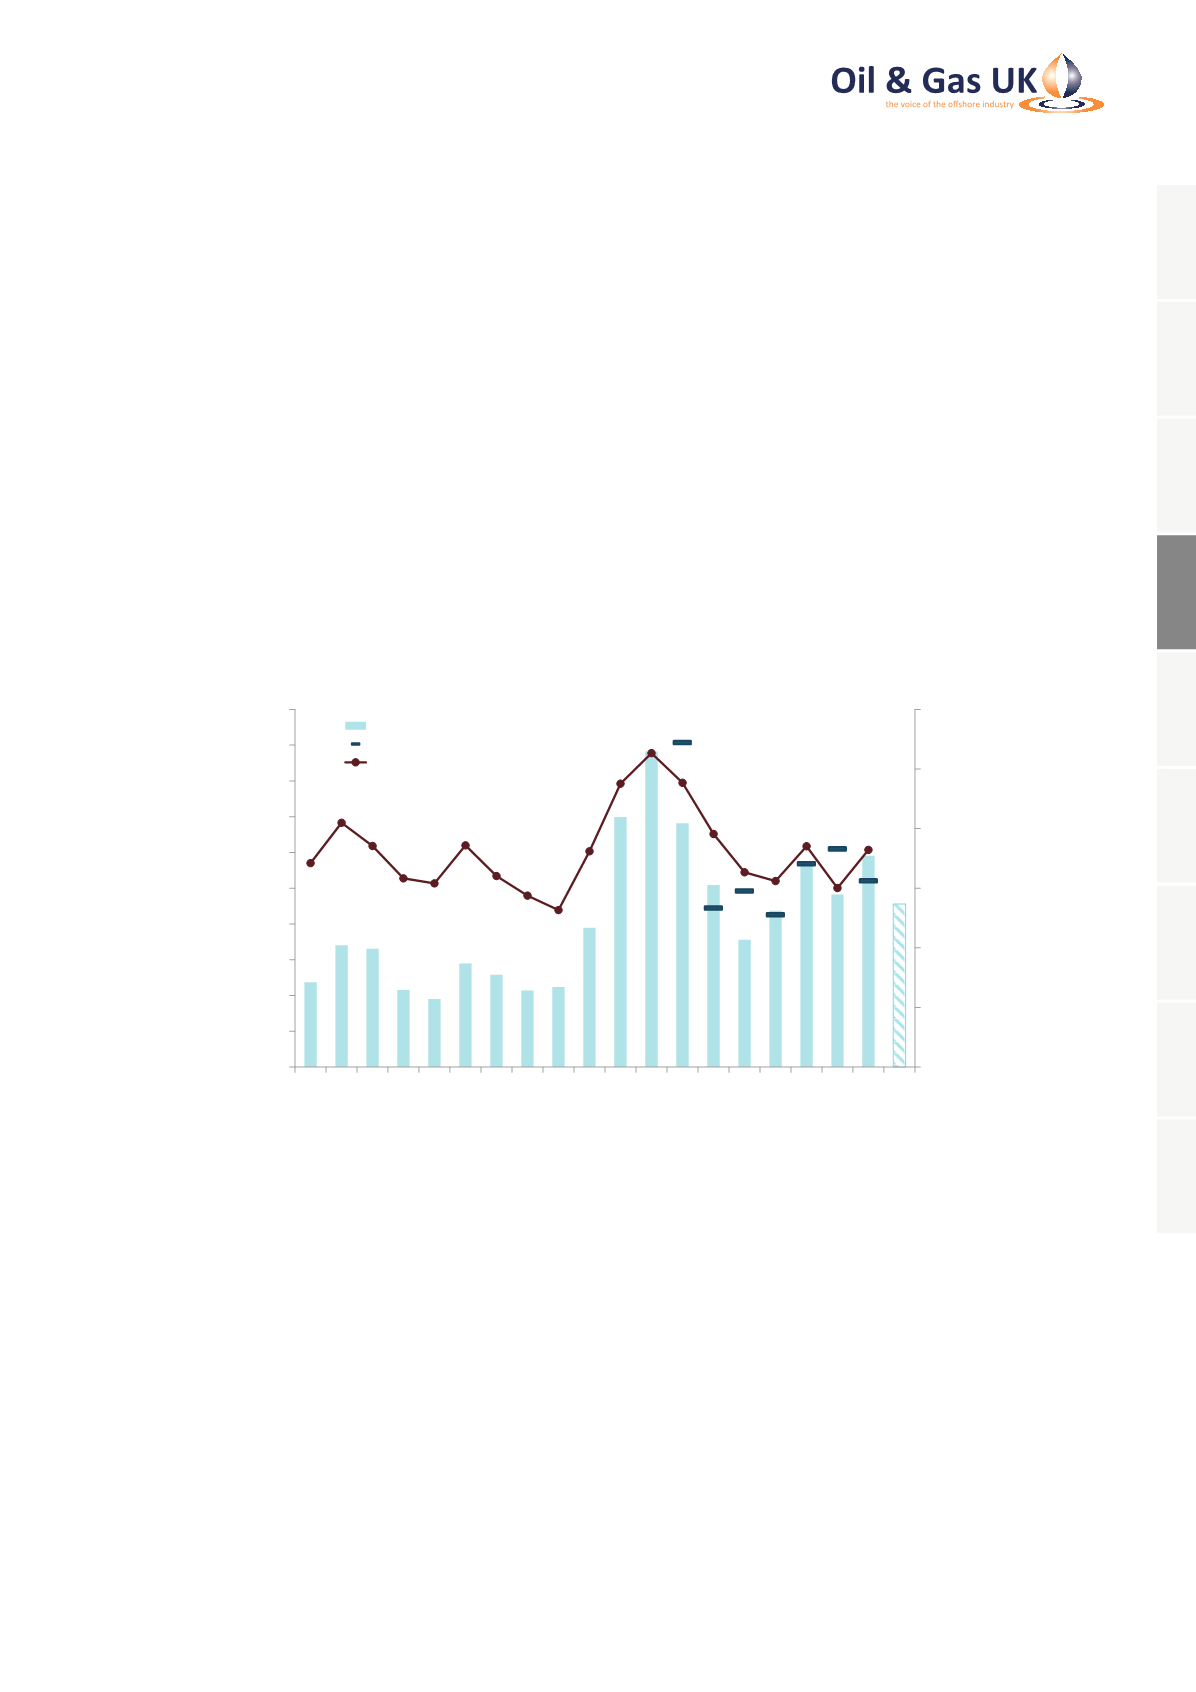
4.2 Earnings Before Interest, Tax, Depreciation and Amortisation (EBITDA)
Earnings before interest, tax, depreciation and amortisation (EBITDA) reflect the operating profit before adding
back the specific non-cash items of depreciation and amortisation and, as such, can indicate the health of the
sector. EBITDA does not account for movements in working capital (stock, debtors and creditors) and, therefore,
it is not a proxy for cash flow.
In 2014, EBITDA was $591 million (£359 million), an increase of nearly 23 per cent on the 2013 figure of
$482 million (£308.5 million). This is 14 per cent higher than the $520 million forecast and is largely due to strong
performance in the first three quarters of 2014. When like-for-like financial information is compared, a 33 per cent
increase is observed. EBITDA is forecast to fall to $456 million in 2015, a decrease of almost 23 per cent.
The EBITDA margin is the ratio of EBITDA to gross revenue and is the percentage remaining after operating
expenses are deducted. This margin has increased from 15 per cent in 2013 to 18 per cent in 2014.
Figure 2: Earnings Before Interest, Tax, Depreciation and Amortisation (EBITDA)
0%
5%
10%
15%
20%
25%
30%
0
100
200
300
400
500
600
700
800
900
1,000
1996
1997
1998
1999
2000
2001
2002
2003
2004
2005
2006
2007
2008
2009
2010
2011
2012
2013
2014
2015 Forecast
EBITDA Margin
$ Million
EBITDA
EBITDA Previous Year Forecast
EBITDA Margin
Source: Oil & Gas UK
1
2
3
4
5
6
7
8
9