


 39 / 110


39
Table 2.1: Atmospheric deposition sources and relative pollutant loads for Lake Victoria
Pollution Source
DomesticWaste (including urban runoff)
Industrial Sources
River Basin
Runoff from Cultivated Land
Runoff from Non Cultivated Land
Atmospheric Wet Deposition
Atmospheric Dry Deposition
Total
Source: Tamatamah et al. 2005
Biochemical Oxygen Demand
17,938
5,606
25,122
–
–
–
–
44,666
Loading to Lake Victoria
Total Nitrogen
3,505 (1.68%)
414 (0.21%)
49,509 (23.78%)
22,966 (11.03%)
29,615 (14.23%)
62,601 (30.08%)
39,550 (18.99%)
208,160 (100%)
Total Phosphorous
1,624 (4.24%)
342 (0.89%)
5,693 (14.86%)
2,297 (6.00%)
3,949 (10.31%)
11,831 (30.89%)
12,567 (32.81%)
38,303 (100%)
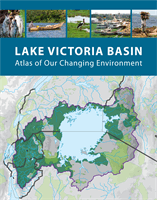
Figure 2.3: Map of sampling stations for atmospheric deposition
Source: Lake Victoria Basin Commission 2005
MARA
SONDU
NYANDO
NZOLA
SIO
GUCHA-MIGORI
GRUMETI
SIMIYU
NYASHISHI
GEITA-BUKOBA
KAGERA
BUKORA
KATONGA
MOGOGO
-
MOAME
ISANGA
KENYA
UGANDA
DEMOCRATIC
REPUBIC OF THE
CONGO
RWANDA
BURUNDI
TANZANIA
Lake
Albert
Lake
Kyoga
Lake
Baringo
Lake
Bogoria
Lake
Naivasha
Lake
Kivu
Lake
Tangayika
Lake
George
Lake
Kyanebalola
Kagera
Lake
Ikimba
Lake
Burigi
Simiyu
Mbalageti
Mara
Nzola
Sondu
Victoria Nile
Katonga
Lake
Kachira
Lake
Wamala
Lake
Edward
Lake Victoria
Copyright©2016GRID-Arendal (LeviWesterveld) ·Cartografare ilpresente/NievesLópez Izquierdo
100 km
Atmospheric deposition sampling stations
Sources: Lake Victoria Environmental Management project, 2005, “Regional Water Quality Synthese Report”;
East African Community, Lake Victoria Commission, 2007, “Strategic Action Plan (SAP) for the Lake Victoria Basin”;
C.K. Twesigye et al., 2011, “The impact of land use Activities on vegetation cover and water quality in the Lake Victoria watershed”,
The Open Environmental Engineering Journal, vol. 4, pp. 66-77; F.L. Mwanuzi et al., 2005, “Lake Victoria Regional Water Quality
Synthesis Report”, Lake Victoria environment management project.
Sub-basins
Lake Victoria basin
Atmospheric deposition
sampling stations
Altitude
4 000
3 000
2 000
1 500
1 000
500
200
5 000 m
Atmospheric Deposition
Atmospheric deposition is considered to be the major
source of pollution in Lake Victoria. As Table 2.1 shows,
total atmospheric deposition (wet and dry deposition)
contributes about 49 per cent and 63.7 per cent,
respectively, of the total nitrogen and phosphorus load.
The data in Table 2.1 is based on data collection and
analysis by Tamatamah et al. (2005) from samples for
atmospheric deposition that were collected from island and
lakeshore stations at Bukasa Island, Entebbe, Lolui Island,
Bukoba, Kadenge and Kisumu, representing the different
rainfall zones of Lake Victoria – as shown in Figure 2.3.