


 6 / 54

2017 OSD Departmental Highlights
pg. 6
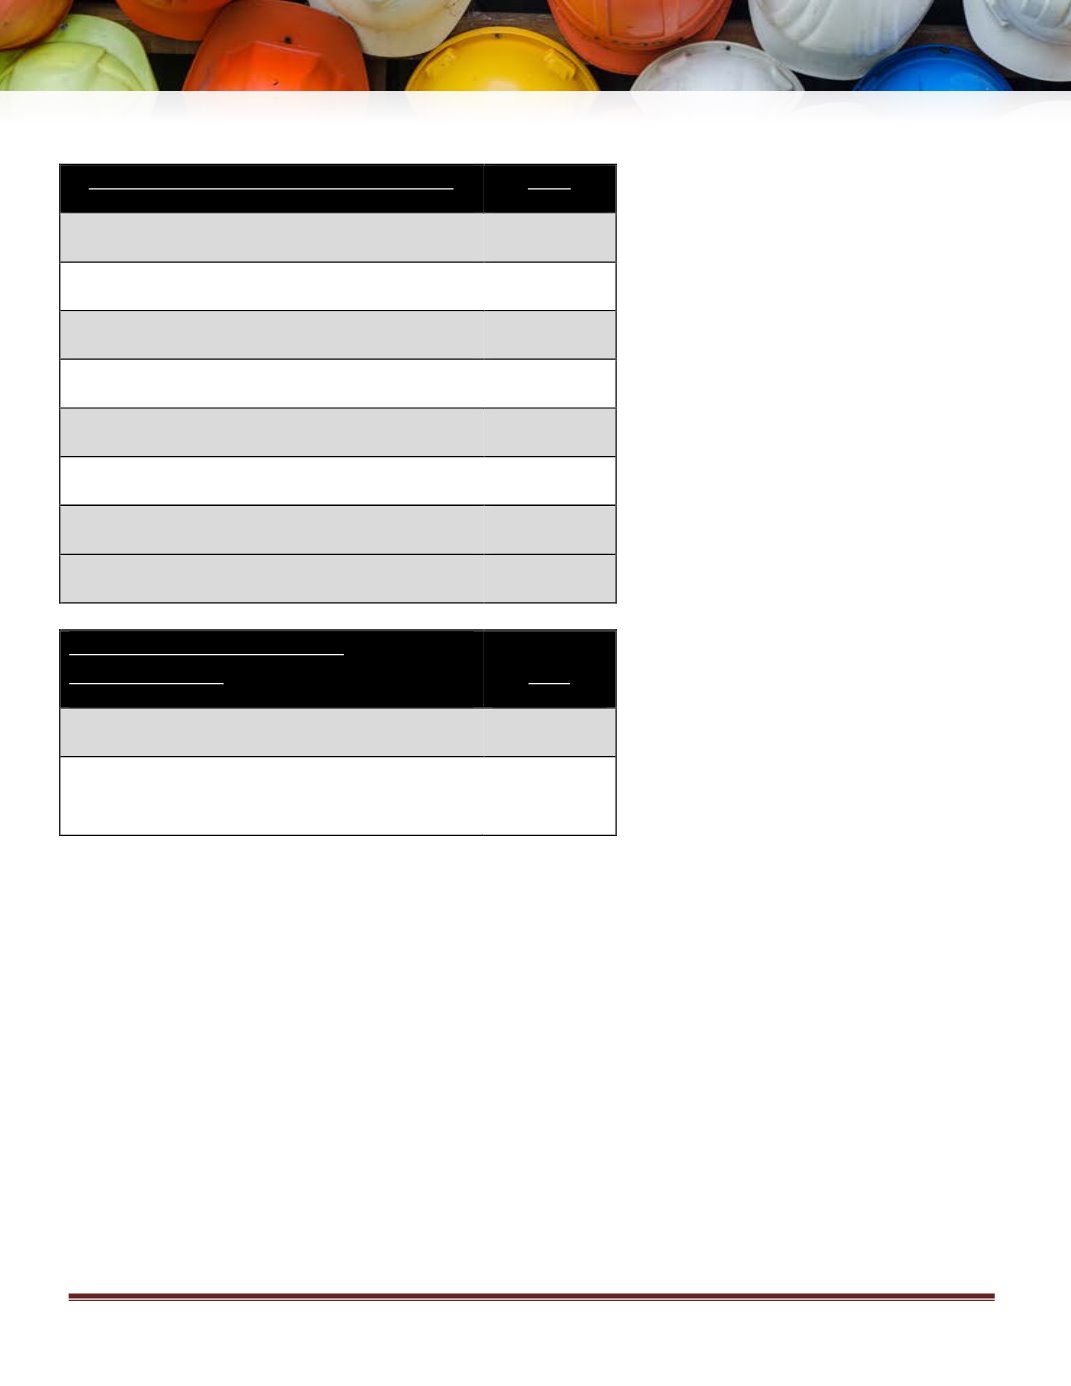
Customer Contact Center (CCC) Metrics
Customer Contact Center (Thru Nov 2017)
2017
Average Calls Per Day
341
Average Calls Per Month
7,510
Total Calls Offered
82,614
Total Calls Answered
76,868
Answer Rate
93%
Average Wait Time
:53
Average Handle Time
4:43
Ring No Answers (RNAs)
361
Other Customer Contact Center
Accomplishments
Date
2-day work from home pilot
April
Quarterly Departmental Meetings
March, June,
September
Additional CCC Accomplishments and Highlights
•
Through November 2017 – 82,614 calls offered and 76,868 calls answered with an answer rate of 93%.
Monthly target is 95%
•
Through November 2017 – 361 Ring No Answers (RNAs) compared to 254 for entire year of 2016. RNAs
occurs when an agent fails to answer a call after 4 rings and the call rolls to the next available agent.
•
January 2017 only 10 RNAs – lowest ever for the CCC
•
Through November 2017 - 341 Average Calls Per Day
•
Through November 2017 – 7,510 Average Calls Per Month
•
Staffing fluctuations and higher call volume was evident in 2017.
•
QA averages increased throughout the year.
•
CCC managed to work through a Finesse/Jabber upgrade.
•
Several Casper enhancement ideas from CCC were approved for Production.