


 8 / 50

historical market performance
Bombardier Business Aircraft
|
Market Forecast 2011-2030
08
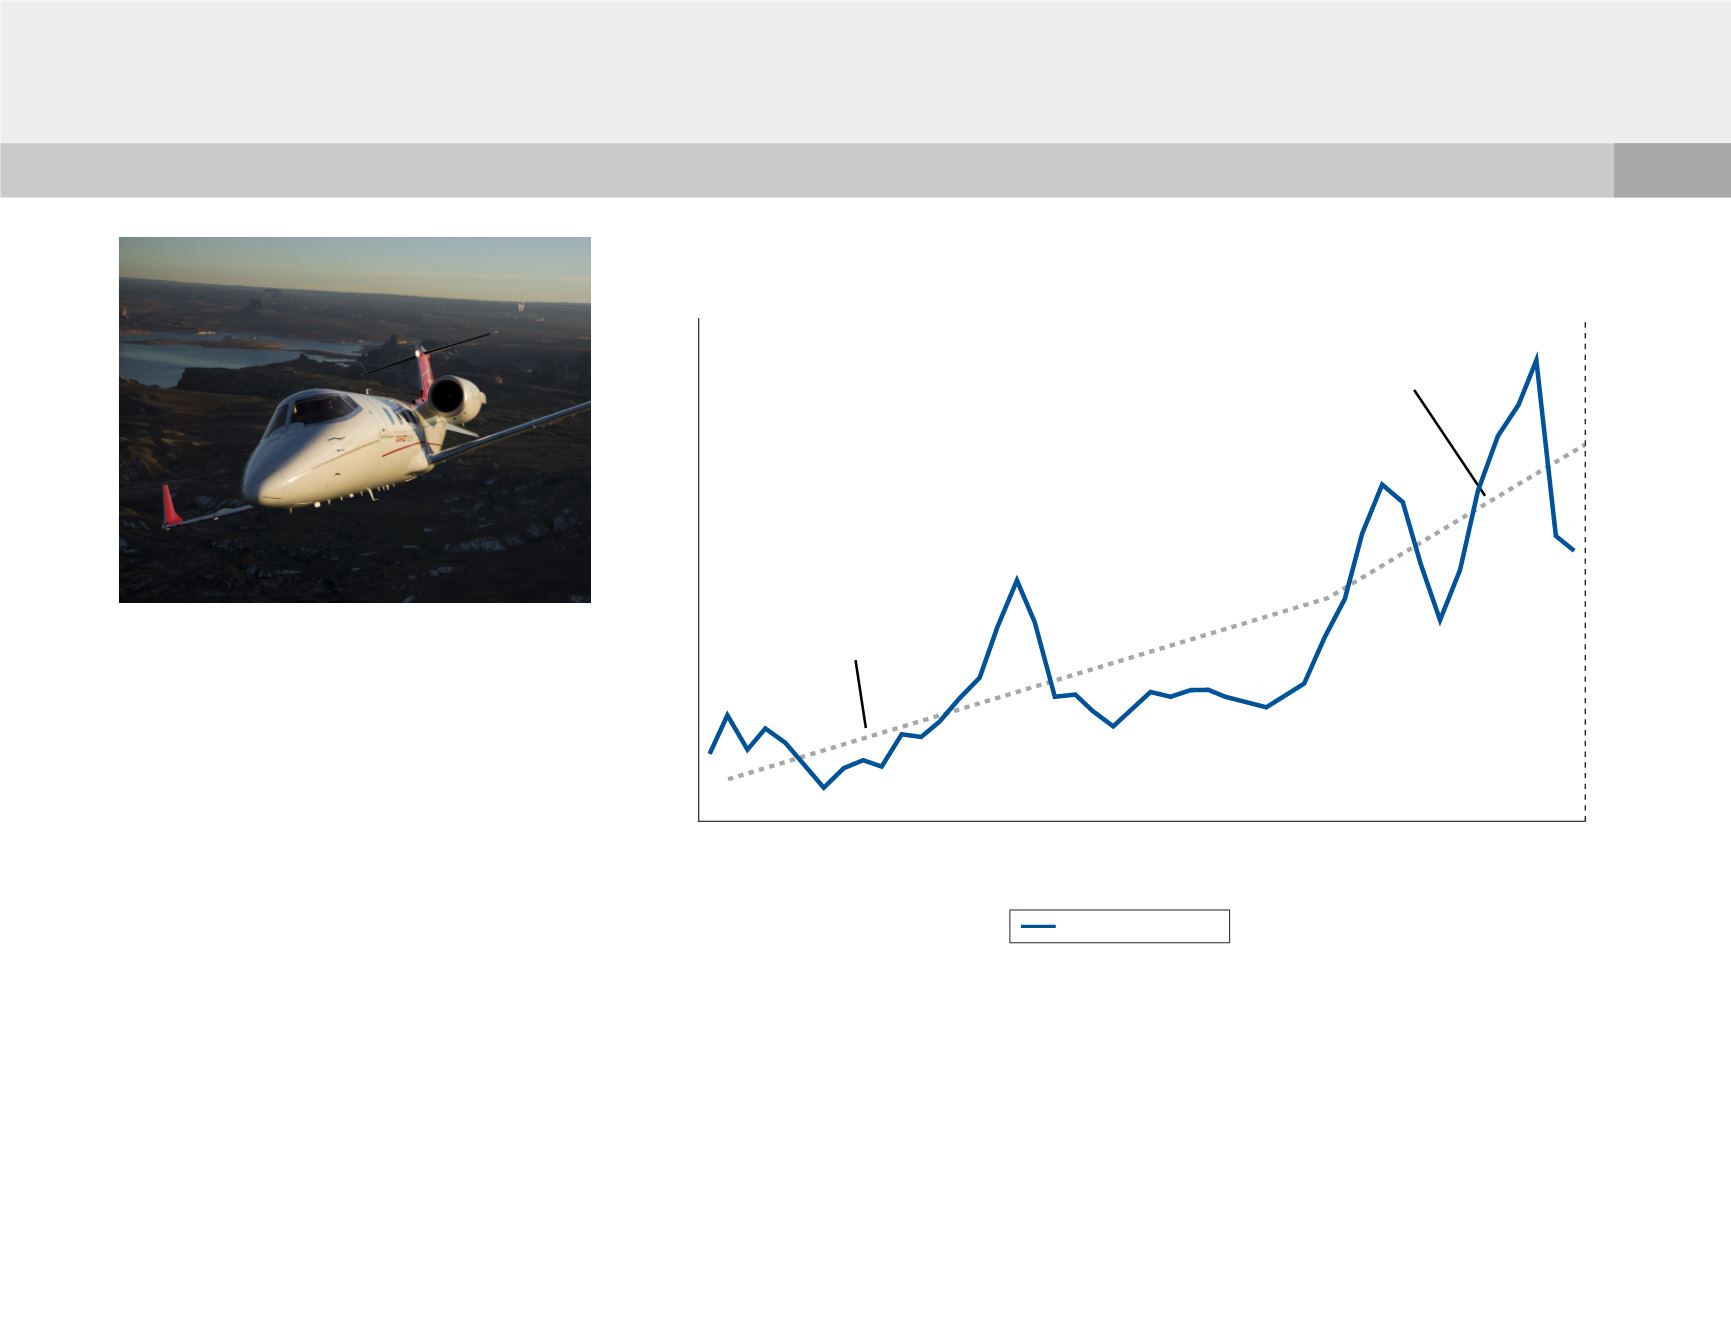
Over the past 40 years, the industry has been
defined by multiple market cycles. From 1965
to 1995, the business jet deliveries CAGR
was at 4%, with most of the growth coming
from the main market, the United States.
After 1995, the business jet industry began
rapidly expanding to other regions of the
world, generating much higher growth, 9%
per year on average.
2004 to 2008
Following the 2001-2003 downturn, the
U.S. economy regained its momentum and
the demand for business jets significantly
rose between 2004 and 2007. New business
aircraft markets such as Europe, Asia and the
Middle East began to generate substantial
demand. Moreover, the launch of new,
innovative aircraft pushed orders even higher.
The 841-unit delivery record set in 2007 was
Historical Business Jet Market Deliveries
Units, calendar years 1965-2010
Source: Actual deliveries from GAMA.
Business Jet Deliveries
0
100
200
300
400
500
600
700
800
900
1,000
1965
1967
1969
1971
1973
1975
1977
1979
1981
1983
1985
1987
1989
1991
1993
1995
1997
1999
2001
2003
2005
2007
2009
2010
CAGR = 9%
CAGR = 4%
Demand for business jets
rose
significantly
in between
2004-2007.