


 9 / 50

historical market performance
Bombardier Business Aircraft
|
Market Forecast 2011-2030
09
shattered in 2008, with deliveries totalling
927 units for the year. Record sales, as well
as a shift in buyer interest toward larger
aircraft, explain the peak of $19.8 billion
in industry revenue reached in 2008.
2008
The near-collapse of financial markets at the
end of 2008 precipitated a sharp downturn in
business aviation. Order activity stalled begin-
ning in the last quarter of 2008 and onwards.
The inventory of pre-owned aircraft for sale
increased dramatically and residual values
took a significant hit. Moreover, OEMs juggled
with cancellations and deferrals. We estimate
that more than 800 order cancellations
were recorded in 2009 in the Light to Large
categories. These unfavourable market
conditions forced most OEMs to decrease
their production that same year. The trough,
in terms of market conditions, was reached
in the first half of 2009.
Since H2-2009
Since the second half of 2009, business jet
usage has increased and pre-owned inventory
has been declining. Credit availability has also
recovered. Market fundamentals improved
significantly in the past 2 years; approximately
500 fewer aircraft for sale on the pre-owned
market (a drop of 3.4 percentage points,
to 14.4% in Q1-2011); 22% and 12% more
flight activity in the U.S. and Europe respec-
tively. Business jet utilization is at its highest
levels since 2007 in both regions.
Recently, we have experienced the resurgence
of multiple aircraft deals. Most aircraft OEMs
are now recording positive net order intake,
signaling that the market has moved to its
second phase of recovery.
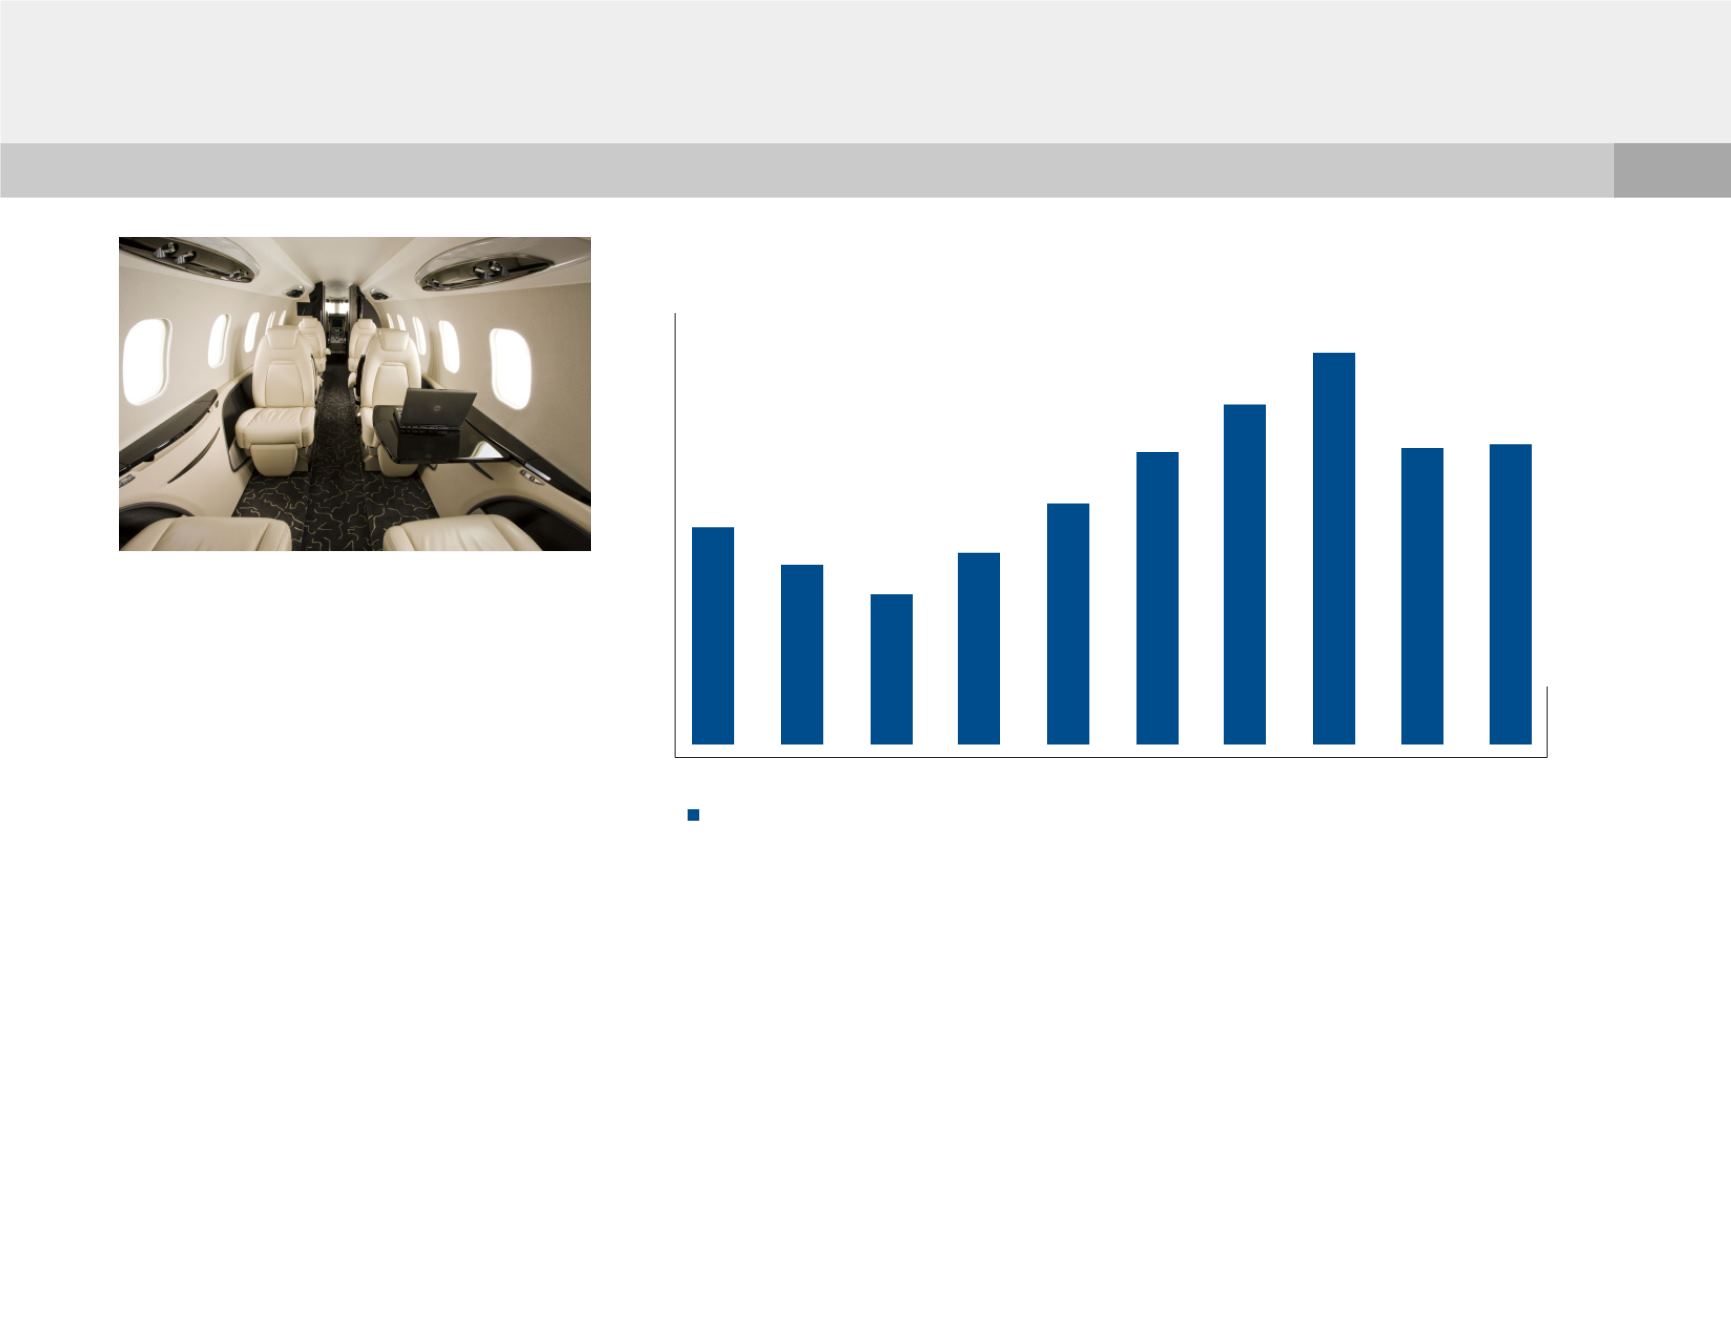
Historical Business Jet Market Revenues
US$B, calendar years 2001-2010
Sources: Revenues estimated from GAMA and B&CA list prices.
All segments in which Bombardier competes
11.0
9.1
7.6
9.7
12.2
14.8
17.2
19.8
15.0
15.2
2001
2002
2003
2004
2005
2006
2007
2008
2009
2010
Revenues ($US Billion)