


 30 / 104


30
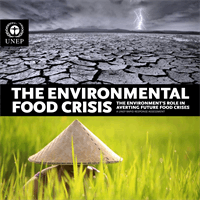
Food eaten/lost (million tons)
Fresh fruits and
vegetables
Fluid milk
Processed fruits and veg
Meat, poultry and fish
Grain products
Caloric sweeteners
Fats and oils
Other foods (including
eggs and other dairy products)
Food eaten Food lost
0
5
10
15
20
25
products and on its scale of production. There is no indication
that marine fisheries today can sustain the 23% increase in
landings required for the 56% growth in aquaculture produc-
tion required to maintain per capita fish consumption at cur-
rent levels to 2050. However, if sustainable, the amount of fish
currently discarded at sea could alone sustain more than a 50%
increase in aquaculture production. However, many of these
species could also be used directly for human consumption.
Fish post-harvest losses are generally high at the small-scale
level. Recent work in Africa by FAO has shown that regard-
less of the type of fisheries (single or multi-species), physical
post-harvest losses (that is, fish lost for human consumption)
are commonly very low, typically around 5% (DieiOuadi, 2007).
Downgrading of fish because of spoilage is considerable, how-
ever, perhaps as high as 10% and more. Hence, the total amount
of fish lost through discards, post-harvest loss and spoilage may
be around 40% of landings (DieiOuadi, 2007).
The potential to use unexploited food waste as alternative
sources of feed is also considerable for agricultural products.
(Figures 11 and 12).
Food losses in the field (between planting and harvesting) could
be as high as 20–40% of the potential harvest in developing
countries due to pests and pathogens (Kader, 2005). Posthar-
vest losses vary greatly among commodities and production ar-
eas and seasons. In the United States, the losses of fresh fruits
and vegetables have been estimated to range from 2% to 23%,
depending on the commodity, with an overall average of about
12% losses between production and consumption sites (Cap-
Figure 11: Food losses for different commodities.
(Source: Kantor
et al
., 1999).
0
1 000
Field
Household
2 000
3 000
4 000
Edible crop
harvest
4600 kcal
After
harvest
4000 kcal
Meat
and dairy
2800 kcal
Harvest
losses
Animal
feed
Available
for household
consumption
2000 kcal
Distribution
losses and
waste
Figure 12: A gross estimate of the global picture of losses, con-
version and wastage at different stages of the food supply chain.
As a global average, in the late 1990s farmers produced the
equivalent of 4,600 kcal/capita/day (Smil, 2000), i.e., before
conversion of food to feed. After discounting the losses, conver-
sions and wastage at the various stages, roughly 2,800 kcal are
available for supply (mixture of animal and vegetal foods) and,
at the end of the chain, 2,000 kcal on average – only 43% of the
potential edible crop harvest – are available for consumption.
(Source: Lundqvist
et al
., 2008).