


 61 / 104


61
-10
-8
-6
-4
-2
0%
Biofuels
Other
non-food
crops
Land
degradation
Urban
build-up
Water
scarcity
Climate
change
Land
degradation
Invasive
species
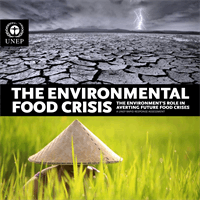
Ranges of possible loss of cropland (%)
Ranges of possible yield loss (%)
Figure 24: Possible individual ranges of yield and cropland area losses by 2050
with climate change (A2 scenario),
non-food crops incl. biofuels (six OECD scenarios), land degradation (on yield and area, respectively, see text), wa-
ter scarcity (including gradual melt of Himalayas glaciers, see box and text) and pests (invasive species of weeds,
pathogens and invertebrates such as insects, see text). Although these effects may be considerable, cumulative
and indirect effects or interactions are not considered here, nor are the cumulative loss of ecosystems services
endangering the entire functioning of food production systems. Notice that the climate impact bar only relates to
changes in general growing conditions incl. temperature, evapotranspiration and rainfall, not the indirect impacts
of climate change such as on glacial melt (water scarcity) and increases in invasive species. The other bars in part
incorporate some of these important climate change impacts. Effects of extreme weather is not included, but could
be substantial (Source: Compiled by UNEP for this report).