


 62 / 124


62 |
South-North Corridor GRIP 2017
\\
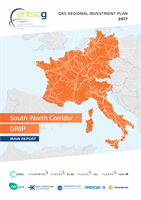
Market Integration,
providing a flexible gas route along the major gas market
places, which will even improve an already high degree of price convergence of
the interconnected gas hubs (Figure 5.2 shows that the major EU gas hubs,
e.g. the ones providing reliable market signals, are stretching along the Region
with a clear price convergence setting).
SI
SE
RO
PT
PL
NL
TTF
LV
LU
LT
IT
HR
GR
UK
NBP
FR
PEG N TRS
FI
ES
EE
DK
DE
CZ
BG
BE
ZEE
AT
IS
IE
SK
HU
NCG/
GPL
VTP
PSV
Import prices declared at the border
Hub hedging prices
Indigenous production
22.2
23.7
21.9
22.2
22.9
25.6
22.3
20.8
21.2
21.3
27.2
27.9
24.8
23.4
21.5
21.3
23.4
25.5 17.6
25.8
22.0
27.8
23.0
22.3
23.4
21.5
21.1
21.9
21.4 21.9
21.1
21.7
22.8
Figure 5.2:
EU Member States assessed gas suppliers’ sourcing prices – 2015 yearly average (map) €/MWh
(Source: ACER Market Monitoring Report 2015 – GAS)