


 5 / 10

where Red and Ox represent the reducing agent and the
corresponding oxidized species, respectively
. 26It is apparent
from the above equilibria that 12-MPA formation would be
incomplete with increasing acidity. The phenolic dissociation
reactions to the more easily oxidizable phenolate conjugate
bases also require su
ffi
cient alkalinity. Thus, optimal amount of
NaOH should be carefully adjusted, as less alkalinity would not
result in quantitative oxidation of phenolics (which require
complete ionization before oxidation), whereas excessive
alkalinity would adversely a
ff
ect the stability of the FC
reagent.
19According to Singleton et al.,
19“
it is important to
have enough but not excessive alkalinity.
”
A similar decrease of
absorbance with increasing NaOH concentration beyond a
certain limit was also noted by Box
25who reported an optimal
pH between pH 10
−
11.5.
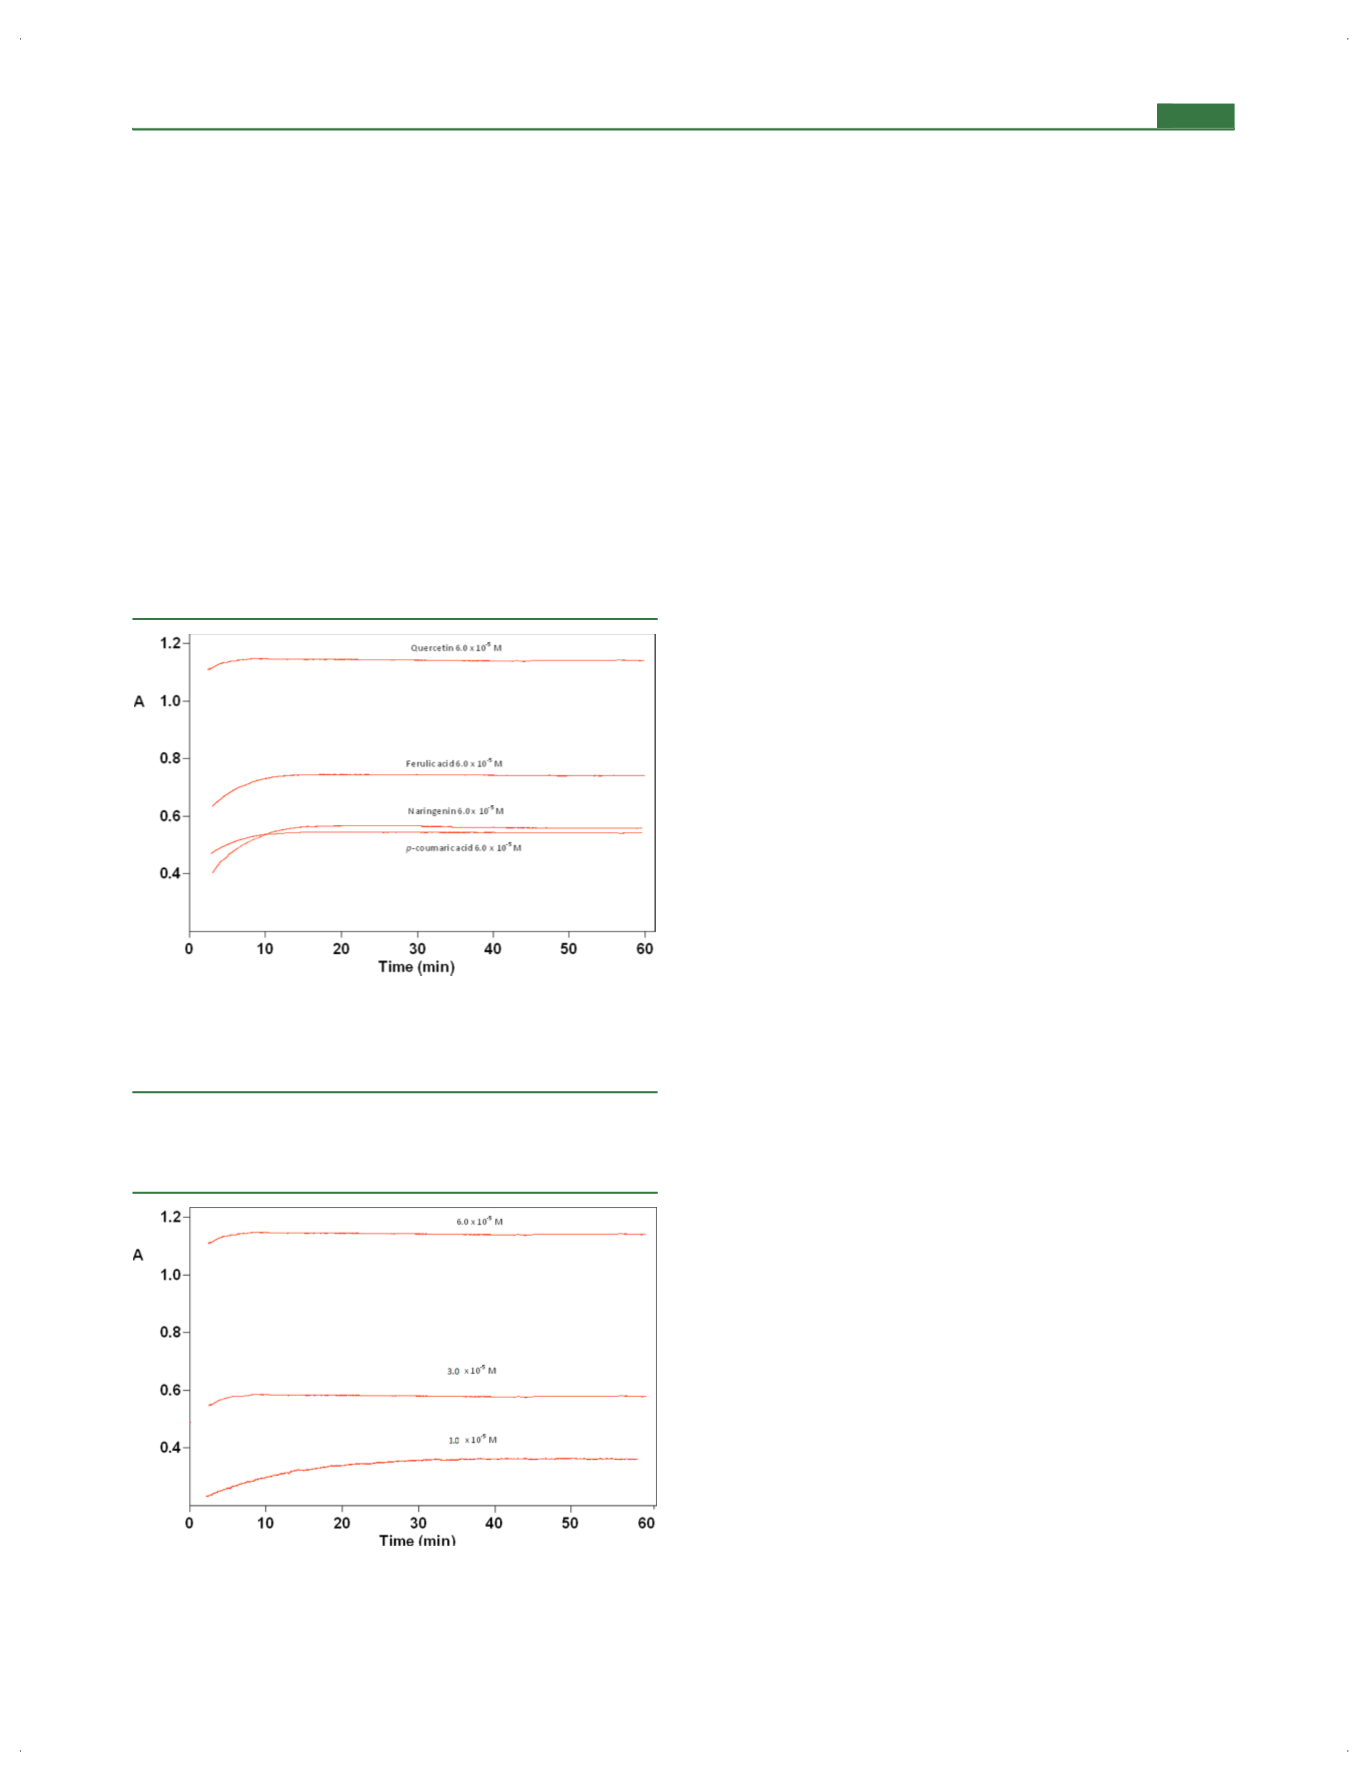
Optimal Reaction Time.
In order to
fi
nd optimal reaction
time, 6.0
×
10
−
5
M quercetin, ferulic acid,
p
-coumaric acid, and
naringenin solutions were tested with the modi
fi
ed FC assay
(Figure
4). In order to see the e
ff
ect of antioxidant
concentration on reaction time, quercetin solutions in the
concentration range 1.0
×
10
−
5
M
−
6.0
×
10
−
5
M were chosen
(Figure
5). The absorbance values of the prepared solutions
were measured at 665 nm for 60 min by allowing the reaction
mixture to stand within the cuvette, as a result of which optimal
reaction time was set as 20 min for further studies.
Linear Concentration Range, Molar Absorption, and TEAC
Coe
ffi
cients of Antioxidants Using the Conventional FC
Method with Acetone Dissolution of Samples.
As reported by
previous researchers, the FC assay could only be applied to
hydrophilic antioxidants and water-soluble food components
because the method in its originally developed form is
inapplicable to hydrophobic phenols and antioxidants
. 4In this
study, both the tested lipophilic and hydrophilic antioxidants
were dissolved in pure acetone medium, and linear
concentration ranges, trolox-equivalent antioxidant capacities
(TEAC coe
ffi
cients), calibration equations, linear regression
coe
ffi
cients, and molar absorptivities were calculated with
respect to the original FC method, as given in Table
1. The
tabulated data (Table
1)are believed to be di
ff
erent from those
in the literature (even for the conventional FC assay) because
of the use of acetone as solvent replacing the routinely used
water or water
−
alcohol mixtures. The characteristic results
presented in Table
1include relatively low correlation
coe
ffi
cients for the calibration equations of a number of
phenolics such as gallic acid, catechin, and especially synthetic
antioxidants (BHT, TBHQ, and LG), and nonquantitative
response to ascorbic acid. Other researchers experienced similar
problems in ascorbic acid determination with the conventional
FC assay, where vitamin C present in the water washing eluate
from the solid phase extraction cartridge had to be destroyed by
heating and thus colorimetrically deduced from the FC
absorbance
. 27The FC application with acetone dissolution of
samples in this work proved neither useful for ascorbic acid (for
which a linear response could not be produced) nor for olive oil
polyphenols (due to insu
ffi
cient solubility). Although ascorbic
acid is 2-e oxidized to dehydroascorbic acid and neatly
determined by the usual TAC assays
, 5it gives erratic results
with the FC assay possibly because dehydroascorbic acid is
enolic and can also react with the FC reagent (i.e.,
dehydroascorbic at 100 mg/L was shown to give FC values
in heated
fl
ow automatic analysis equivalent to 45 mg of gallic
acid per liter).
19To overcome the mentioned di
ffi
culties, the
development of a modi
fi
ed FC assay capable of measuring
lipophilic antioxidants (including synthetic antioxidants) along
with hydrophilic ones was necessary.
Linear Concentration Range, Molar Absorption and TEAC
Coe
ffi
cients, and Limits of Detection and Quanti
fi
cation
(LOD and LOQ) of Antioxidants Using the Modi
fi
ed FC
Method with Acetone Dissolution of Samples.
Calibration
curves using the modi
fi
ed FC assay were obtained for certain
antioxidant compounds, namely, trolox, quercetin, rutin, gallic
acid, ca
ff
eic acid, ferulic acid, rosmarinic acid, glutathione,
cysteine, ascorbic acid, vitamin E, BHA, BHT, LG, TBHQ, and
β
-carotene. The linear concentration ranges, linear calibration
equations (of absorbance versus concentration), regression
coe
ffi
cients, and molar absorption coe
ffi
cients were calculated
for each antioxidant compound and are given in Table
2. Limit
of detection (LOD) and limit of quanti
fi
cation (LOQ) values
for each antioxidant molecule were calculated by taking 3 and
10 times the standard deviation of a blank, respectively, and
dividing by the slope of the calibration line (i.e., molar
absorption coe
ffi
cient). The modi
fi
ed FC method was validated
through analytical
fi
gures of merit including LOD, LOQ,
recovery (%), and relative standard deviation (RSD, %), found
by standard additions of vitamin E to olive oil and trolox to
Figure 4.
Optimization of reaction time tested with 6.0
×
10
−
5
M
antioxidant (quercetin, ferulic acid, naringenin, and
p
-coumaric acid)
solution + 300
μ
L of modi
fi
ed FC reagent + 3.5 mL of 0.1 M NaOH
solution + distilled water of dilution to a total volume of 10.0 mL.
Figure 5.
Optimization of reaction time tested with (50, 150, and 300)
μ
L of 2.0
×
10
−
3
M quercetin solution + 300
μ
L of modi
fi
ed FC
reagent + 3.5 mL of 0.1 M NaOH solution + distilled water of dilution
to a total volume of 10.0 mL.
Journal of Agricultural and Food Chemistry
Article
dx.doi.org/10.1021/jf400249k|
J. Agric. Food Chem.
2013, 61, 4783
−
4791
4786