


 7 / 10

with CUPRAC: TEAC
CUPRAC
= 1.20 TEAC
mod.Folin
+ 0.051 (
r
=
0.802). Conventional FC with CUPRAC: TEAC
CUPRAC
= 0.25
TEAC
Folin
+ 1.24 (
r
= 0.493). Modi
fi
ed FC with ABTS:
TEAC
ABTS
= 0.55 TEAC
mod.Folin
+ 1.00 (
r
= 0.466). Conven-
tional FC with ABTS: TEAC
ABTS
= 0.05 TEAC
Folin
+ 1.67 (
r
=
0.134).
TAC Determination of Synthetic Mixtures of Anti-
oxidants.
Ternary and quaternary synthetic mixtures of
hydrophilic and lipophilic antioxidants (the latter with or
without olive oil as a complex sample medium) were analyzed
with the modi
fi
ed Folin
−
Ciocalteu method, and the observed
overall TAC values were found to approximate the sum of the
individual TAC values of constituents. The results for the
theoretically expected and experimentally found TAC values
were in agreement within 10%, as shown in Table
5. In
addition, the theoretically expected and experimentally found
absorbance values of ternary synthetic mixtures of antioxidants
in olive oil sample agreed within
±
5% (Table
6).
Additivity and Interference E
ff
ects in TAC Determi-
nation.
Additivity of antioxidant capacities of individual
antioxidants in a mixture is important in de
fi
ning TAC, and
the additivity property of antioxidant capacities can be
demonstrated either in synthetic antioxidant mixtures (as in
Tables
5and
6)or in the standard addition of a selected
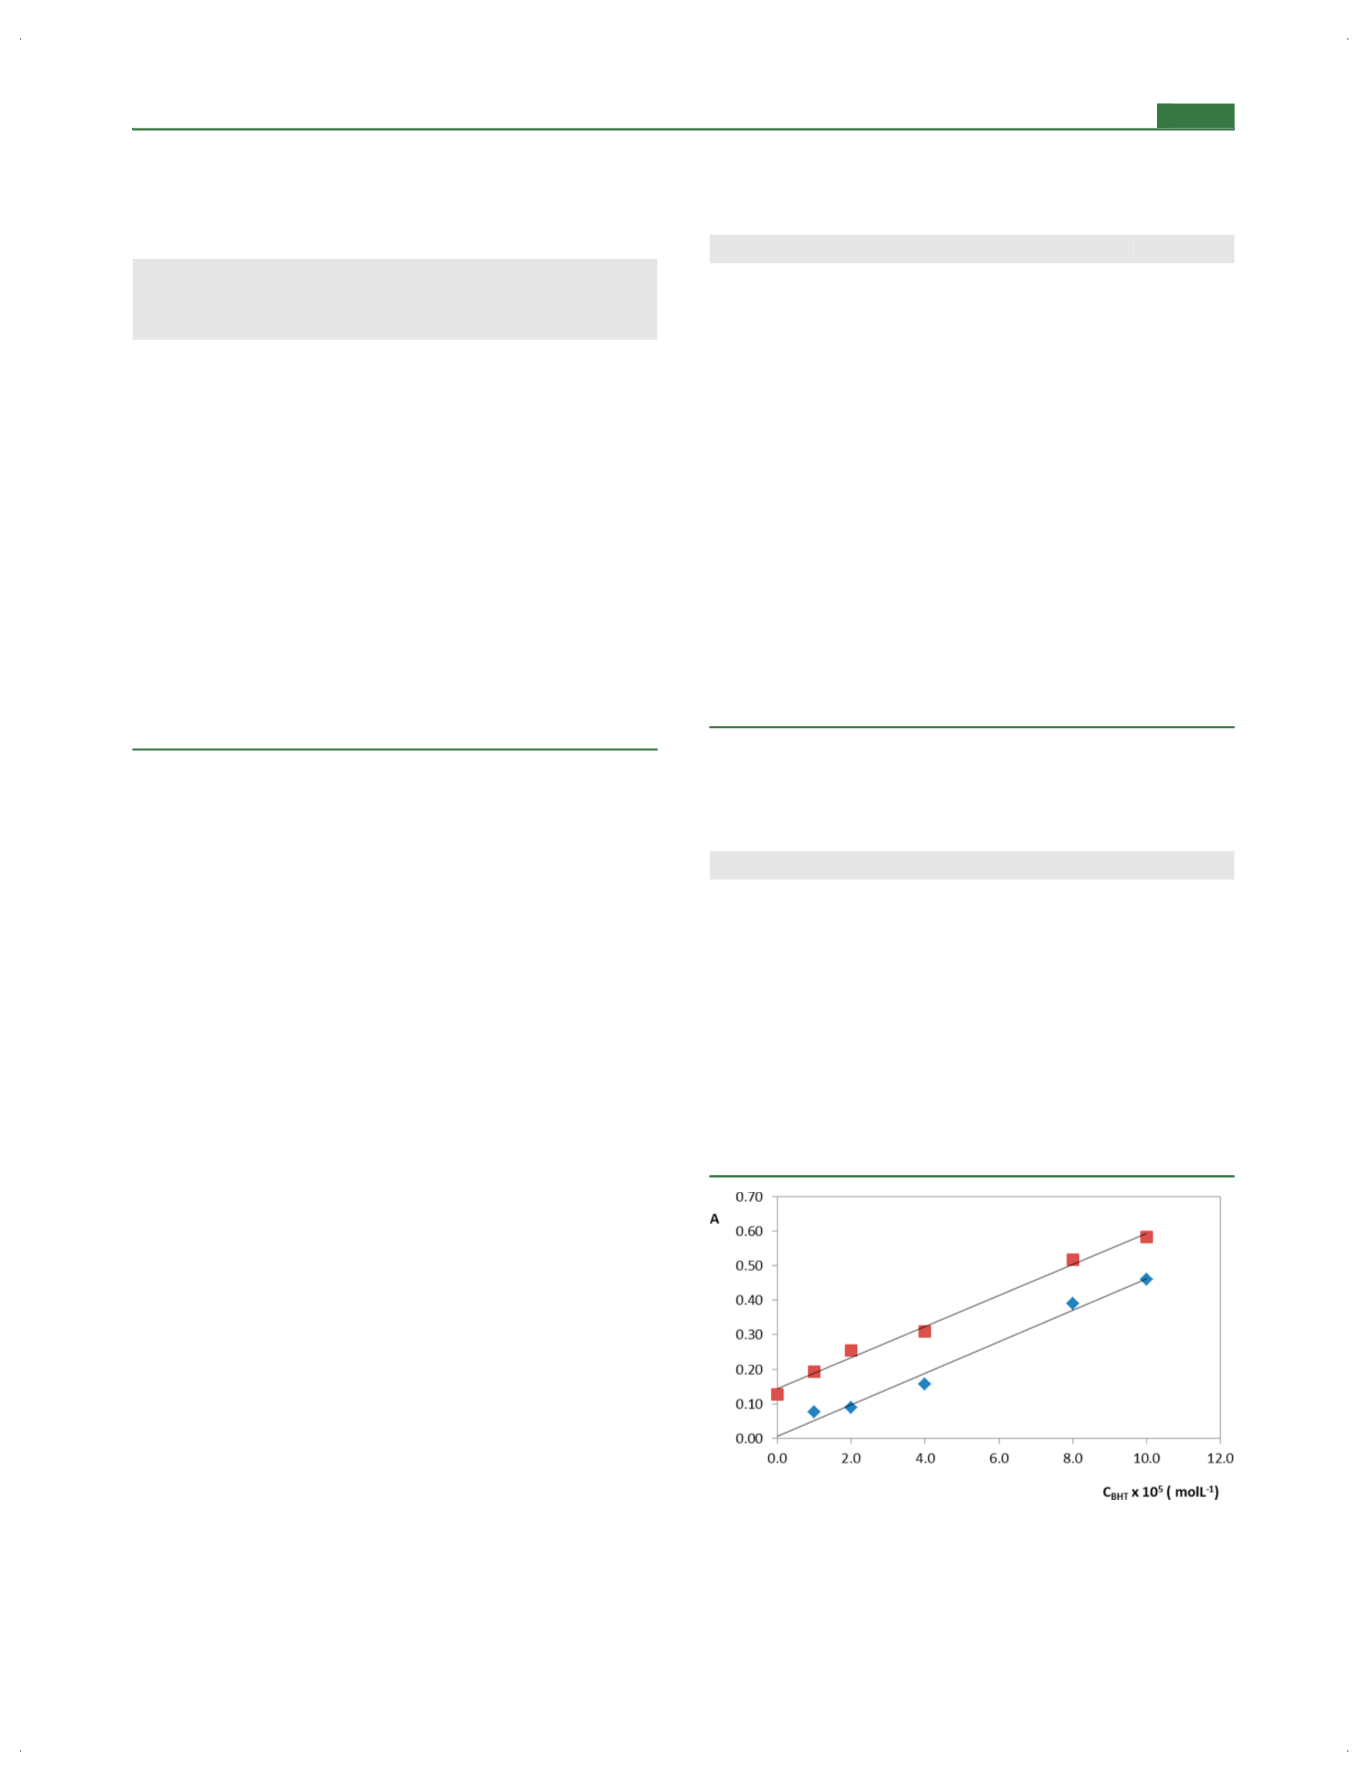
antioxidant to a complex mixture. When applying the standard
addition method, the calibration curves of a chosen antioxidant
fi
rst in standard reaction medium and second in another
antioxidant solution or complex matrix such as olive oil/sage/
green tea extract were drawn (Figures
6 − 8). Figures
6 − 8indicate the parallelism of the mentioned pair (i.e., the slopes
agreed within
±
10%) of curves and consequently the lack of
interference (in the form of association, dissociation, or
interaction with solvent molecules) in the modi
fi
ed FC assay
in agreement with Beer
’
s law.
The potential interferents common in food plants and
botanicals such as citric acid, glucose, mannitol, serine, lysine,
valine, proline, and alanine did not signi
fi
cantly a
ff
ect the
Table 4. Comparison of the TEAC Coe
ffi
cients of the Tested
Antioxidants Using Modi
fi
ed and Conventional Folin
−
Ciocalteu Methods with Those Found by Reference TAC
Assays
antioxidants
modi
fi
ed
Folin
−
Ciocalteu
method
original
Folin
−
Ciocalteu
method CUPRAC ABTS FRAP
trolox
1.00
1.00
1.00
1.00 1.00
quercetin
2.78
1.80
5.77
3.98 2.92
gallic acid
1.78
2.54
3.25
4.17 1.85
ferulic acid
1.88
5.59
1.47
1.70 0.87
ca
ff
eic acid
2.61
5.54
2.89
1.39 1.13
catechin
3.23
10.6
3.10
2.40 1.24
vitamin E
0.39
2.04
1.02
1.00
BHT
0.82
2.92
0.77
0.98
BHA
0.99
3.16
1.57
1.23
TBHQ
1.90
1.38
1.02
1.20
LG
1.30
4.54
1.68
2.26
ascorbic acid
1.60
1.03
0.99 1.01
β
-carotene
0.34
0.72
1.75
2.14
rosmarinic
acid
4.08
10.5
5.2
glutathione
1.02
1.60
0.64
1.51
cysteine
0.66
0.82
0.39
1.28
Table 5. Theoretically Expected and Experimentally Found
TAC Values (as mM Trolox-Equivalents) of Synthetic
Mixtures Using the Modi
fi
ed Folin
−
Ciocalteu Method
synthetic mixture
TAC
expected
TAC
found
deviation (%)
2.5
×
10
−
2
mM ascorbic acid
0.127
0.118
−
7.08
5.0
×
10
−
2
mM cysteine
1.4
×
10
−
1
mM vitamin E
2.5
×
10
−
2
mM quercetin
0.185
0.178
−
3.78
1.4
×
10
−
1
mM vitamin E
7.5
×
10
−
2
mM BHT
2.0
×
10
−
2
mM trolox
0.285
0.290
+1.75
2.0
×
10
−
2
mM gallic acid
2.0
×
10
−
2
mM BHA
2.5
×
10
−
2
mM quercetin
0.152
0.137
−
9.86
2.5
×
10
−
3
mM rosmarinic acid
2.5
×
10
−
2
mM BHA
2.5
×
10
−
2
mM TBHQ
2.5
×
10
−
1
mM trolox
0.295
0.280
−
5.08
2.5
×
10
−
2
mM BHT
2.5
×
10
−
2
mM BHA
2.5
×
10
−
2
mM ca
ff
eic acid
0.196
0.182
−
7.14
2.5
×
10
−
2
mM quercetin
7.5
×
10
−
2
mM BHT
Table 6. Theoretically Expected and Experimentally Found
Absorbance (
A
) Values of Synthetic Mixtures of Lipophilic
Antioxidants in Olive Oil Using the Modi
fi
ed Folin
−
Ciocalteu Method
synthetic mixture
A
expected
A
found
deviation (%)
3.75
×
10
−
2
mM BHT
0.948
0.912
−
3.83
1.25
×
10
−
2
mM TBHQ
6.00
×
10
−
2
mM trolox
olive oil
2.50
×
10
−
2
mM BHA
0.840
0.868
+3.22
3.75
×
10
−
2
mM BHT
1.25
×
10
−
2
mM TBHQ
olive oil
2.50
×
10
−
2
mM vitamin E
0.745
0.725
−
2.57
1.25
×
10
−
2
mM TBHQ
1.88
×
10
−
2
mM BHA
olive oil
Figure 6.
Calibration line of BHT (the regression equations:
◆
,
y
=
4.55
×
10
3
x
+ 0.0068,
R
2
= 0.9830, in pure reaction medium,
■
,
y
=
4.50
×
10
3
x
+ 0.1436,
R
2
= 0.9926, in BHA solution) with respect to
the modi
fi
ed Folin
−
Ciocalteu method.
Journal of Agricultural and Food Chemistry
Article
dx.doi.org/10.1021/jf400249k|
J. Agric. Food Chem.
2013, 61, 4783
−
4791
4788