


 12 / 28

12 |
Ten-Year Network Development Plan 2017 Annex F: Methodology
€
Quantity
Social Welfare
Marginal
Price
S
D
EU bill
€
Quantity
Social Welfare
Marginal
Price
S
D
EU bill
Figure 3.4a:
Social Welfare before the project
€
Quantity
S
D
EU bill
€
Quantity
S
D
EU bill
Figure 3.5a:
Social Welfare with inelastic demand
before the project
Figure 3.4b:
Social Welfare after the project
Figure 3.4b:
Social Welfare with inelastic demand
after the project
Storage target
For each simulation, a target storage level is used, and is set equal to the initial lev-
el.
For the normal year simulation (summer + winter), this target is mandatory. The goal
is to evaluate a normal situation in a sustainable running mode, and therefore the
storage use must be neutral over the course of the year.
For the Peak and 2 Week cold Spell simulations, the target level is not mandatory,
meaning that storage working gas volume can be used as much as needed (the lim-
itation being on the withdraw capacity).
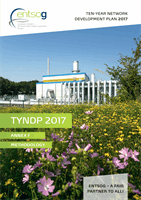
Evaluation of the social welfare
All benefits coming along the gas chain including suppliers, infrastructure operators
and end-consumers are included in the social welfare.
Based on economic theory, the European social welfare is defined as the yellow area
between the supply and demand curves. The change in social welfare induced by a
project is then additional red stripped area resulting from the change of the supply
curve where there is a better access to cheap source (additional red part at the bot-
tom of the curve) as shown in following figures (also defining the marginal price as
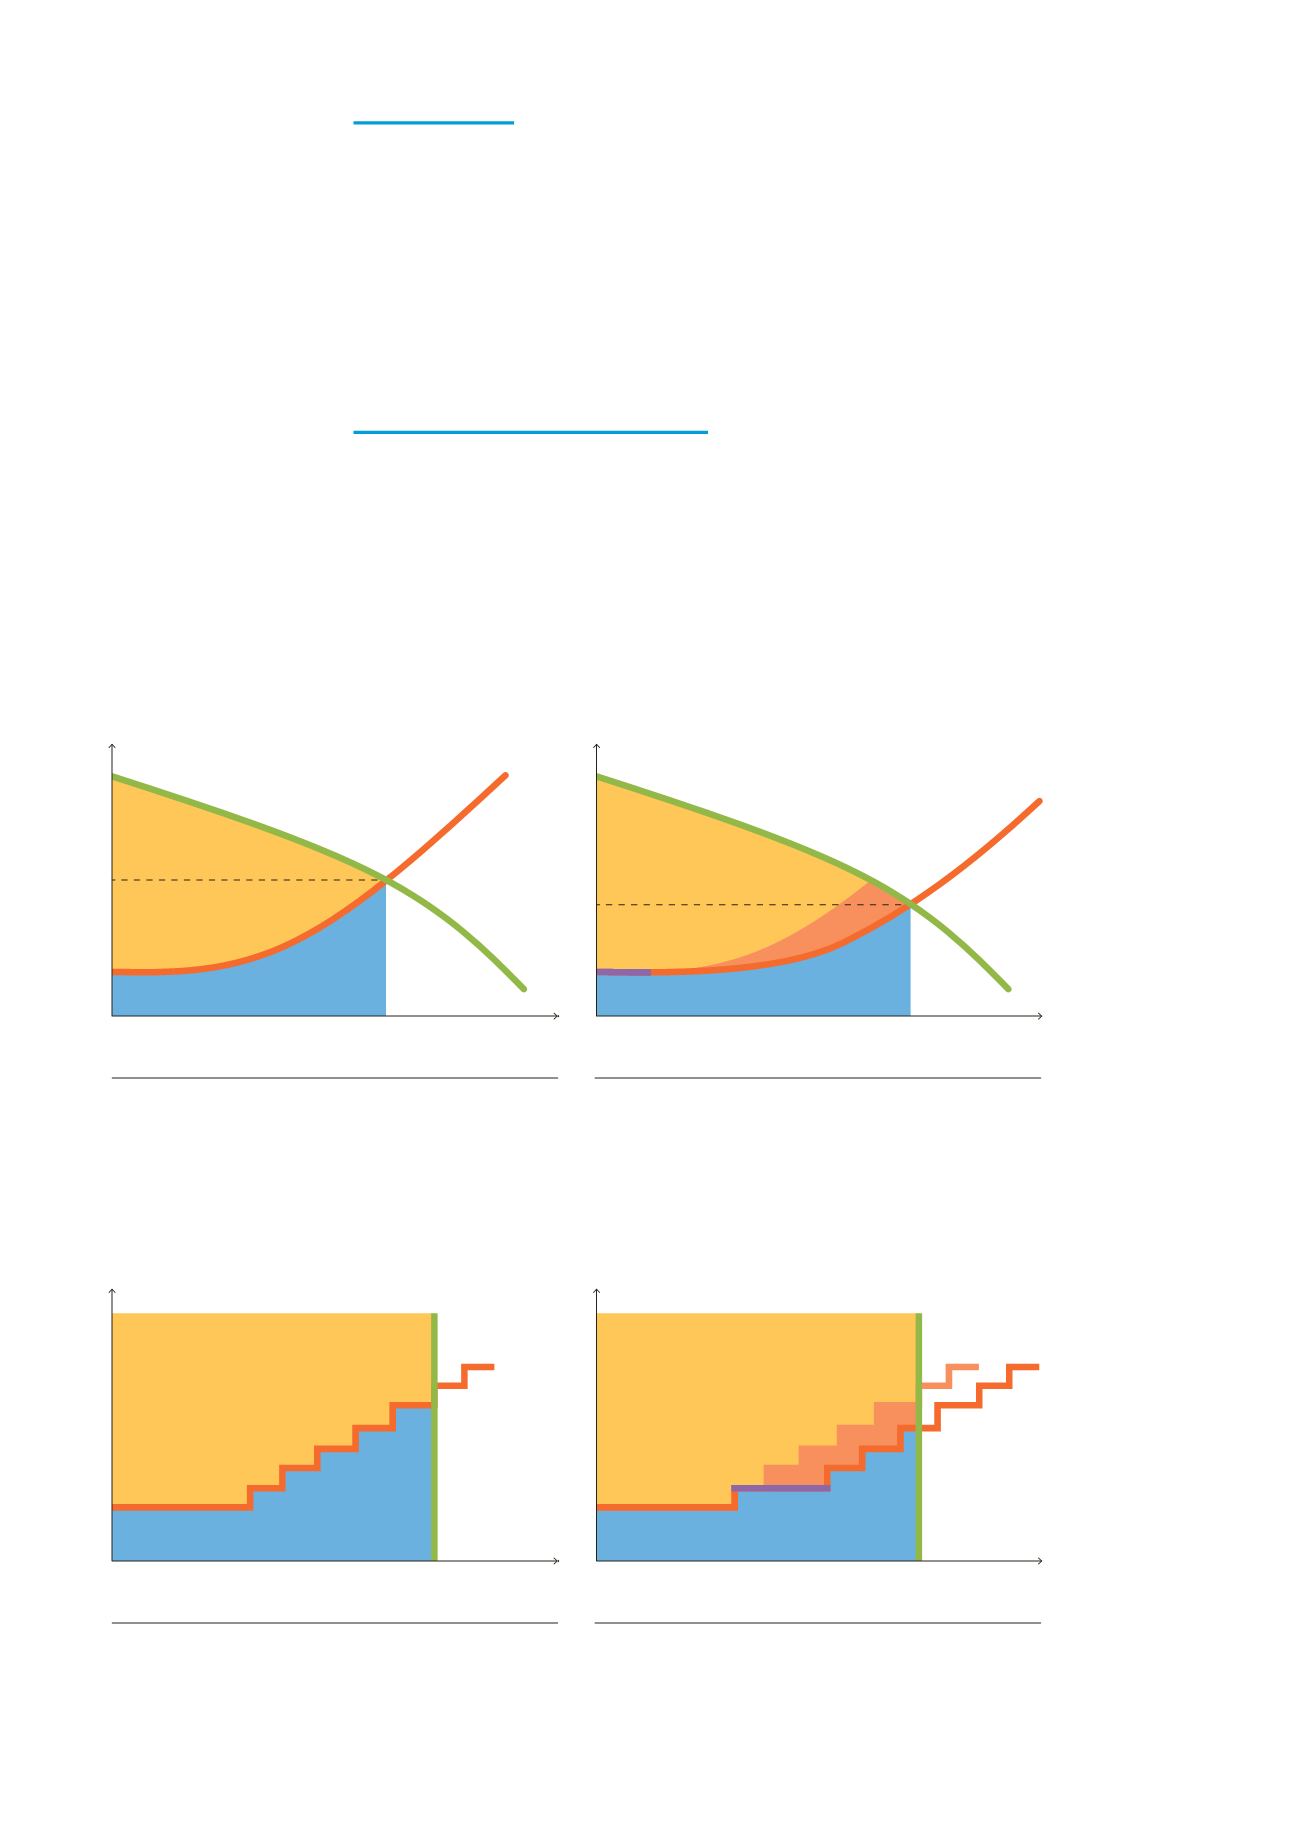
the intersection of the two curves):
Applying this approach to the ESW-CBA modelling approach with an inelastic de-
mand, the change in Social Welfare is equivalent to the change in the gas bill as
shown in the following figures: