


 44 / 59

Self Storage
Performance Quarterly
Source: Cushman & Wakefield, Inc. The
Self Storage Performance Quarterly
, a publication of Cushman & Wakefield, Inc., is intended solely for use by paid subscribers.
Reproduction or distribution in whole or part without written permission is prohibited and subject to legal action. Copyright® 2017
Cushman & Wakefield | Valuation & Advisory
39
Section IV – Real Estate Investment Trusts (REITs) Performance
Data 1
st
Quarter 2017
The following performance data comes from the four public companies same store pool and supports the
conclusions drawn from the Self-Storage Performance Index and other trends SSDS tracks. There are however,
slight differences which are mostly attributable to the following:
1. SSDS only tracks the trends in the 100 square foot non-climate-controlled units.
2. The SSDS estimate of Rent per Available Square Foot does not take into consideration
a. Bad Debt
b. Existing tenants paying something other than the current asking rental rate
c. Ancillary income
3. The SSDS trends reflect the whole nation geographically while the individual REITs are more confined to
regions of the country
0.0%
2.0%
4.0%
6.0%
8.0%
10.0%
12.0%
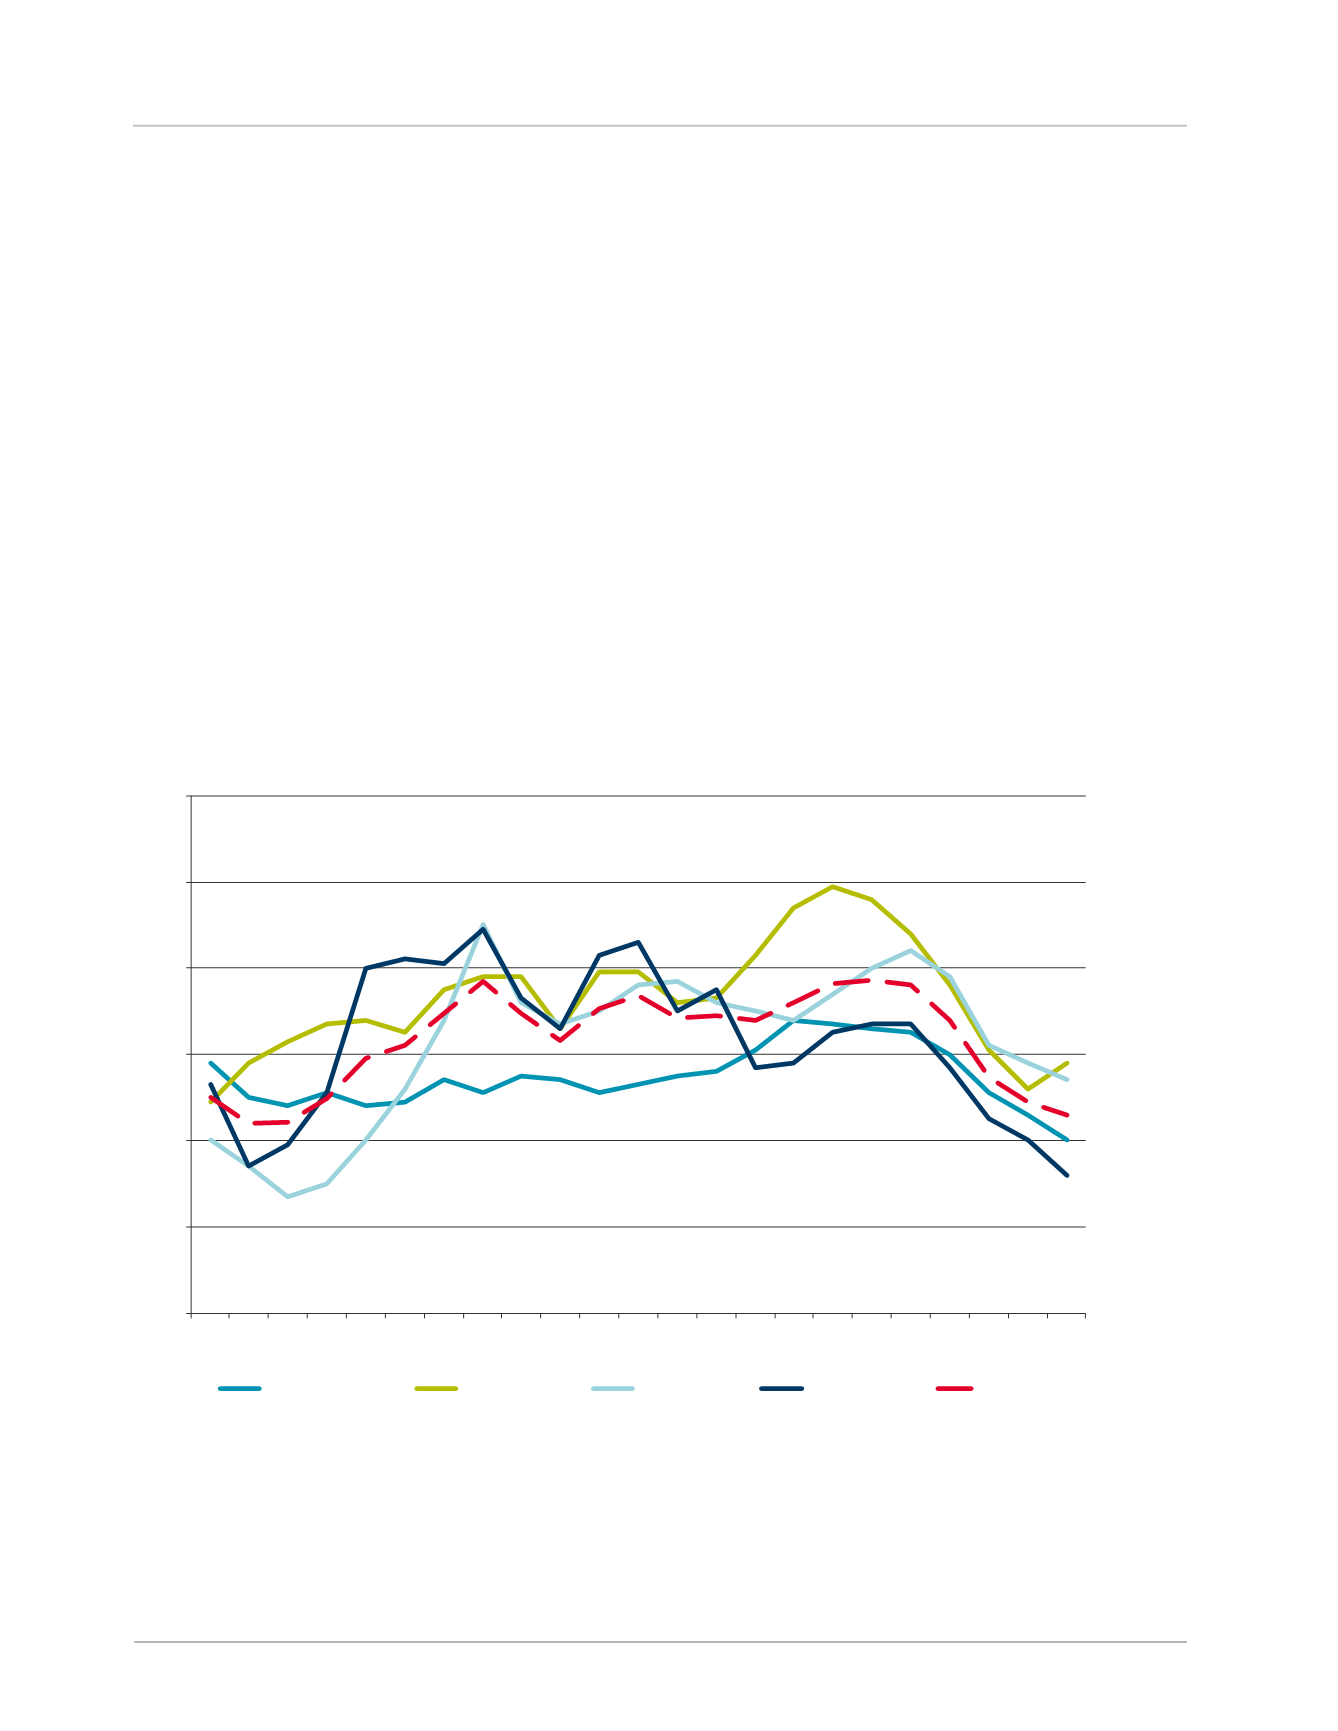
3Q11 1Q12 3Q12 1Q13 3Q13 1Q14 3Q14 1Q15 3Q15 1Q16 3Q16 1Q17
Percent Change
Real Estate Investment Trust
Percent Change in Revenue
Same Store Portfilio
Public Storage
Extra Space
CubeSmart
Life Storage
Average