


 13 / 24

$120
$127
$136
$160
$142
$152
$176
$228
$237
$229
$0
$50
$100
$150
$200
$250
2008
2009
2010
2011
2012
2013
2014
2015
2016
2017
AoA Rx Claims PEPM
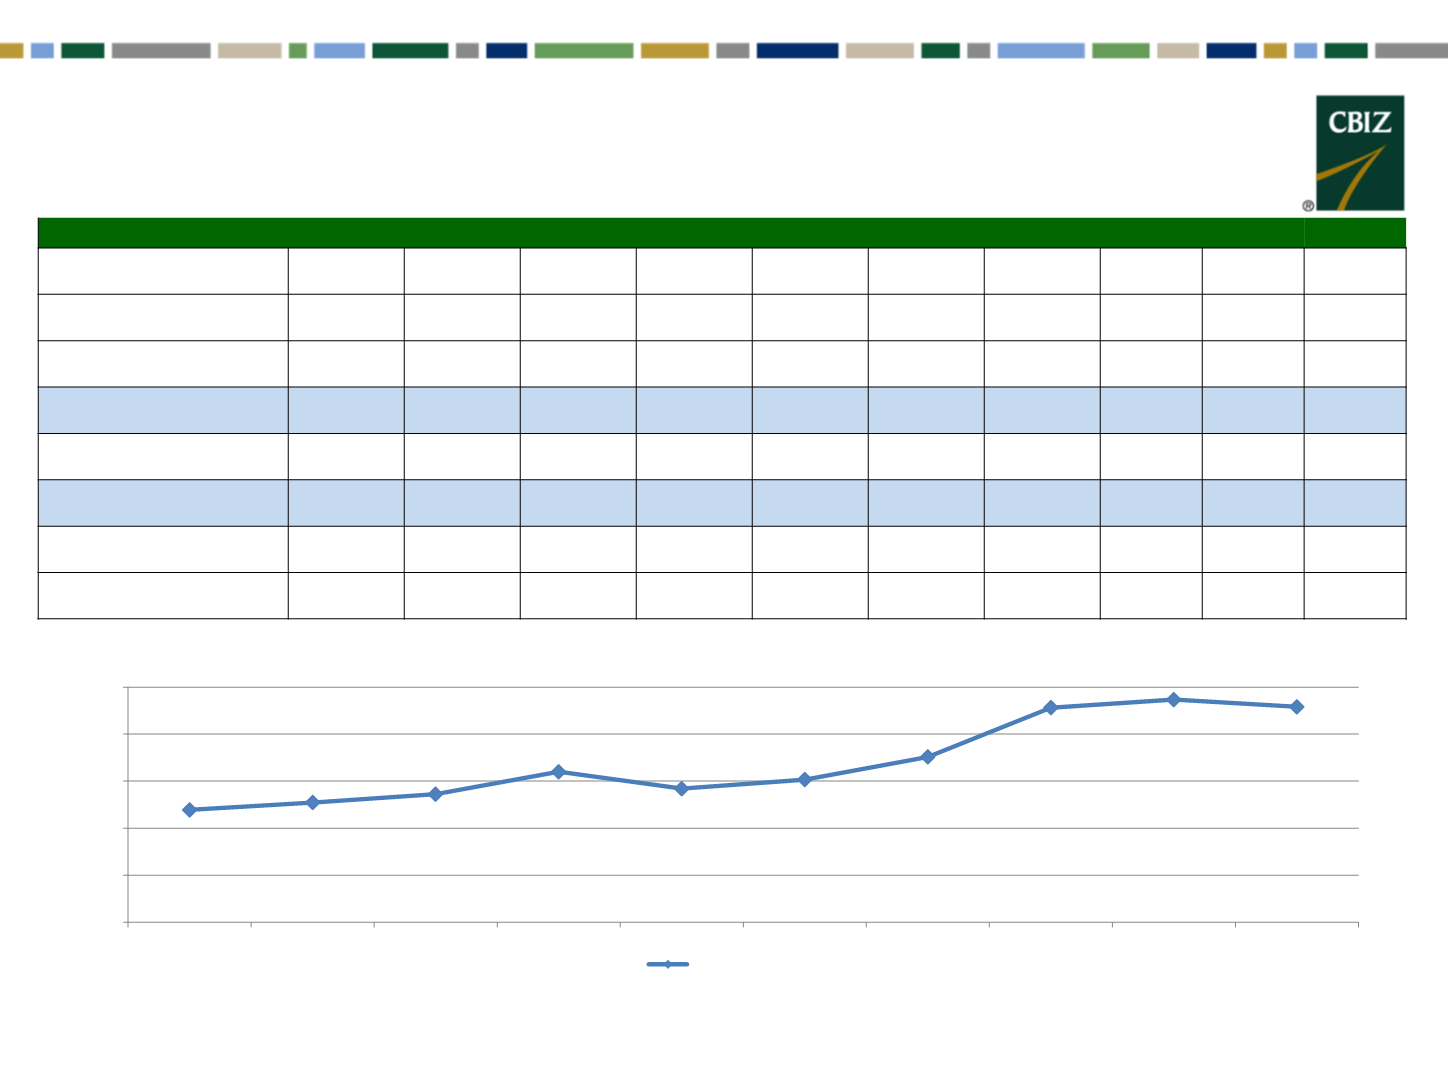
Rx Trend History - PEPM
PEPM
2008
2009
2010
2011
2012
2013
2014
2015
2016
2017
Total Actual Average Rx Costs
PEPM
$119.52
$127.27
$136.15
$160.06
$142.09
$151.63
$175.84
$228.20
$236.79
$229.03
Annual Rx Spend (2016 YTD)
$2,367,283
$2,429,772
$2,527,109
$2,935,703
$2,577,489
$2,740,035
$3,208,810 $4,185,564 $4,360,788 $1,398,011
AoA Actual Change Year over
Year
N/A
6.5%
7.0%
17.6%
-11.2%
6.7%
16.0%
29.8%
3.8%
-3.3%
Average Monthly Covered
Employees
1,651
1,591
1,547
1,528
1,512
1,506
1,521
1,529
1,535
1,526
Year over Year Change
N/A
-3.6%
-2.8%
-1.2%
-1.1%
-0.4%
1.0%
0.5%
0.4%
-0.6%
Loss Ratio
92%
73%
78%
86%
82%
81%
81%
91%
97%
89%
Percent of Paid Claims due to Rx
15.9%
20.3%
19.9%
20.3%
18.7%
19.3%
21.3%
23.4%
21.5%
21.9%
Note: 2017 data is YTD of April 30, 2017.
Experience Reports: Jan-Dec 2017
Committee Meeting
13