


 40 / 120


40 |
BEMIP Gas Regional Investment Plan 2017
3.3.3 ENERGY MIX
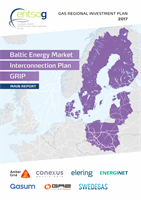
Finland has a rather diversified energy mix which can be seen from the graph below:
Wood fuels
Import from Lithuania in 2015
0%
30%
25%
20%
15%
10%
5%
2015 (The figures were corrected on 18 April 2016)
2014
25.6%
23.9%
18.7%
8.0%
6.1%
4.6%
4.5%
4.1%
3.8%
0.6%
0.3%
0.9%
4.4%
4.8%
3.5%
7.1%
9.4%
18.3%
23.0%
25.2%
Oil
Nuclear energy
Coal
Natural gas
Hydro
Net imports
of electricity
Peat
Others
Wind
Figure 3.15:
Total energy consumption by sources, 2015 (Source: Statistics Finland).
In 2015 natural gas accounted for about 20% of the fuels used in the production of
district heat and CHP production as shown in the figure 3.17 and about 6% of the
electricity production as shown in figure 3.16. On the scale of the whole country,
natural gas accounts some 6% of the use of primary energy.
Nuclear power
Hydro power
Net imports
Biomass
Coal
Natural gas
Peat
Wind power
Waste fuels
Oil
%
0.9
0.2
2.8
19.8
13.0
6.7
6.1
3.1
27.7
20.1
Figure 3.16:
Electricity supply by energy sources 2015
(82.5 TWh) in Finland (Source:
Energy Finland)Renewables
Coal
Natural gas
Peat
Other
Secondary heat
Oil
%
2.5
20.3
15.0
4.9
3.3
32.6
21.4
Figure 3.17:
Fuel consumption in production of district heat
and CHP in 2015 in Finland – fuel consumption
52.0 TWh (Source:
Energy Finland)