


 14 / 24


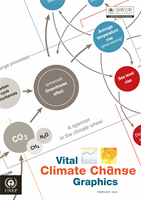
Emissions continue to increase
P
ast and future CO 2 atmospheric concentrations
200
300
1000
1200
1400
1600
1800
2000
A1B
A1T
A1FI
A2
B1
B2
IS92a
Scenarios
2100
200
300
400
500
600
700
800
900
1,000
0
100
100
0
Ice core data
Direct
measurements
Projections
ppm
375
Emissions reporting
Central to any study of climate change
is the development of an emissions
inventory that identifies and quanti-
fies a country’s primary anthropogenic
sources and sinks of greenhouse gas.
The IPCC has prepared guidelines for
compiling national inventories. The
major greenhouse gases are included
within six sectors: Energy; Industrial
Processes; Solvent and Other Product
Use; Agriculture; Land Use Change and
Forestry; and Waste.
Emissions are not usually monitored
directly, but are generally estimated
using models. Some emissions can be
calculated with only limited accuracy.
Emissions from energy and industrial
processes are the most reliable (using
energy consumption statistics and in-
dustrial point sources). Some agricul-
tural emissions, such as methane and
nitrous oxide carry major uncertainties
because they are generated through
biological processes that can be quite
variable.
Contributing to emissions
Historically the developed countries
of the world have emitted most of the
anthropogenic greenhouse gases. The
U.S. emits most in total, and is one of
the countries with highest emissions
per capita. China is the second largest
emitter, but has very low emissions per
capita. Over the last 20 years, indus-
trial development has led to a rapid rise
in the volume of emissions from Asia,
but on a per capita basis, emissions in
this region are still at the bottom of the
global scale.
Since pre-industrial times, the atmospheric concentration of greenhouse gases has grown sig-
nificantly. Carbon dioxide concentration has increased by about 31%, methane concentration by
about 150%, and nitrous oxide concentration by about 16% (Watson
et al
2001). The present level
of carbon dioxide concentration (around 375 parts per million) is the highest for 420,000 years, and
probably the highest for the past 20 million years.
GREENHOUSE GAS EMISSIONS
14
0
1
2
3
4
5
6
7
8
1980
1990 1995 2000
Source : EIA, 2002.
CO
2
emissions
from consumption
and flaring of
fossil fuels
North
America
Latin
America
Western
Europe
Eastern Europe
and Former
Soviet Union
Middle
East
Africa
Asia and
Oceania
1985
Billion tonnes