


 9 / 24

VITAL
CLIMATE CHANGE
GRAPHICS
9
A climate model can be used to simulate the temperature changes that occur from both natural and
anthropogenic causes. The simulations in a) were done with only natural forcings: solar variation
and volcanic activity. In b) only anthropogenic forcings are included: greenhouse gases and sulfate
aerosols. In c) both natural and anthropogenic forcings are included. The best match is obtained
when both forcings are combined, as in c.
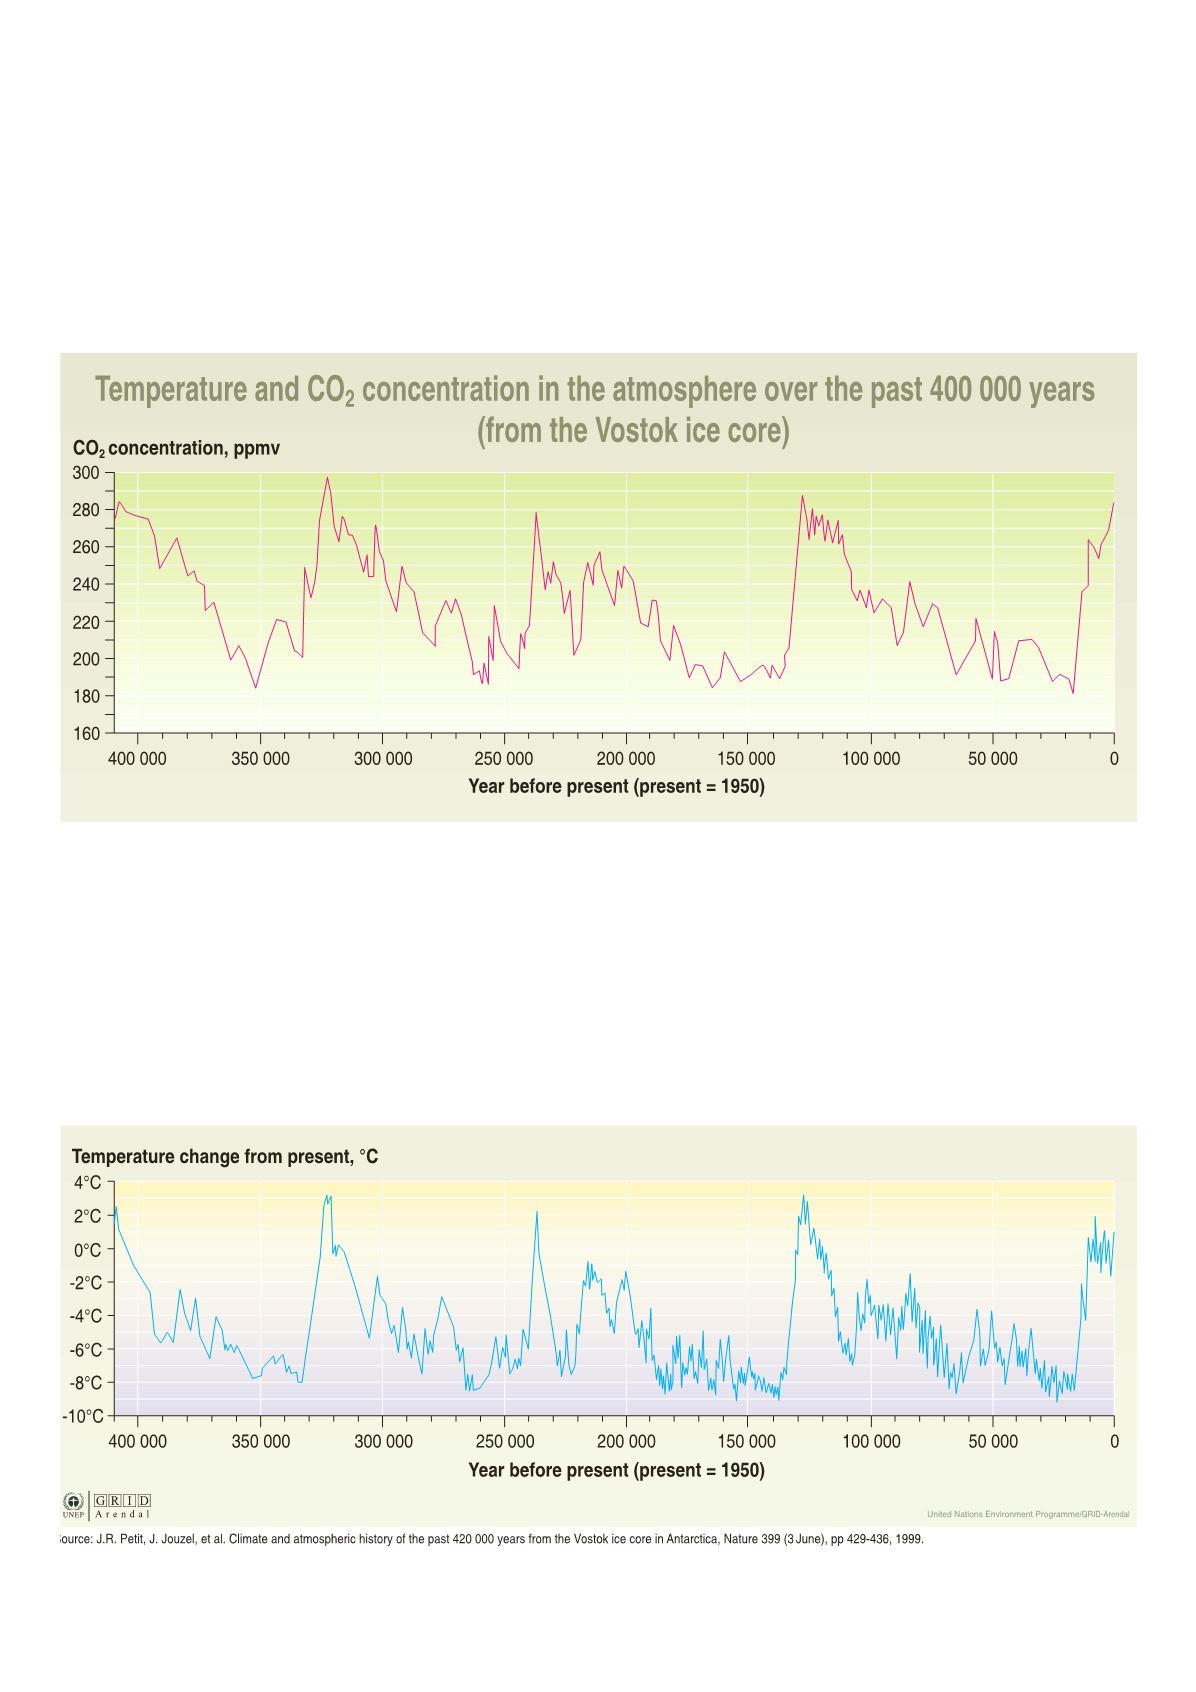
The information presented on this graph indicates a strong correlation between carbon
dioxide content in the atmosphere and temperature. A possible scenario is when
anthropogenic emissions of greenhouse gases bring the climate to a state where it reverts
to the highly unstable climate of the pre-ice age period. Rather than a linear evolution, the
climate follows a non-linear path with sudden and dramatic surprises when greenhouse
gas levels reach an as-yet unknown trigger point.