


 7 / 24

VITAL
CLIMATE CHANGE
GRAPHICS
7
Choose your own weather
You were dreaming of a perfect future world
– longer summers, milder winters, greener
grass – maybe the IPCC has invented it for
you. They have proposed four sets of sce-
narios, each with a different answer to the
fundamental question: will the 21st century
be more and more industrialised, or more
and more environmentally friendly?
Inventing new worlds
To invent the future, the references we have
are the present – and the past. We build
scenarios on the bases of existing or past
trends and behaviour, and in this respect,
they might teach us more about present pro-
cesses than about future expectations. For
example, we don’t know what is around the
corner in terms of new technologies – tech-
nologies that could accelerate the impacts
or mitigate the effects. However flawed the
exercise might be, it is crucial for the climate
change debate – as accurate a description
of our future landscape as possible.
Scenarios are developed and fine-tuned as
more is discovered about the climate system.
In 2000, the IPCC proposed new scenarios,
described in a Special Report on Emissions
Scenarios (Nakicenovic and Swart 2000).
These replaced earlier scenarios established
in 1992. Observations showed that the pre-
dicted changes were occurring much faster
than forecast in the 1990s. These newer
scenarios also include a range of socio-eco-
nomic assumptions, such as the population
growth, economic development, energy use
and environmental concerns envisaged in
both global and regional contexts.
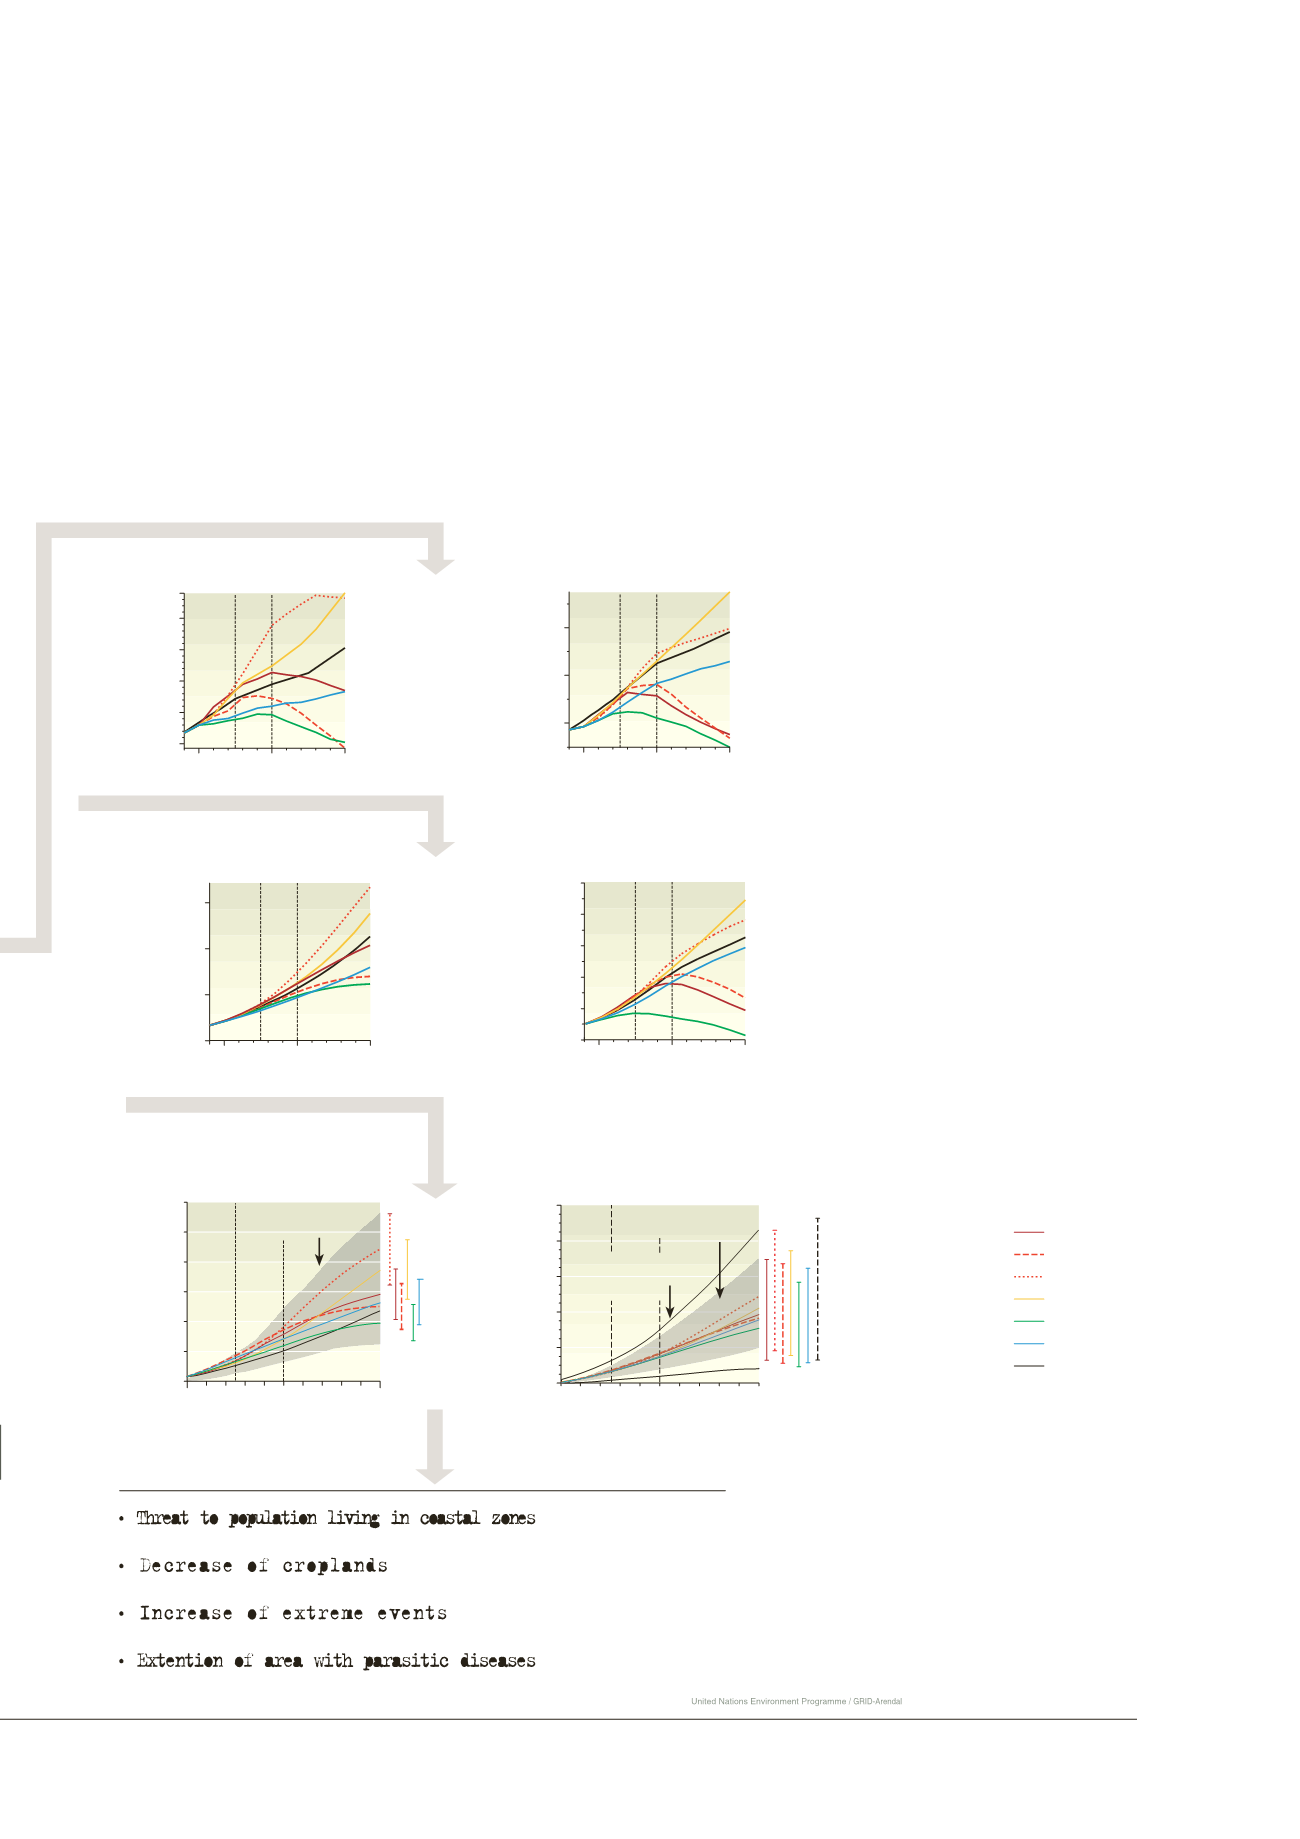
EMISSIONS
CONCENTRATIONS
IMPACTS
A1B
A1T
A1FI
A2
B1
B2
IS92a
Scenarios
10
20
CO
2
emissions (Gt C)
30
2000 2050 2100
600
800
CH
4
emissions (Tg CH
4
)
2000 2050 2100
CO
2
concentration (ppm)
300
500
700
900
2000 2050 2100
CH
4
concentration (ppb)
1500
2500
3500
2000 2050 2100
0
2
4
6
Temperature change (°C)
Bars show the
range in 2100
produced by
several models
2000
2100
2050
Model ensemble
all SRES envelope
0.0
0.2
0.4
0.6
0.8
1.0
Sea-level rise (m)
Bars show the
range in 2100
produced by
several models
2000
2100
2050
All IS92
Model ensemble
all SRES envelope
All SRES envelope
including land-ice
uncertainty
The scenario IS92A is from IPCC’s Second
Assessment Report (1995) and it assumes
that world population grows to 11.3 billions
by 2100, economic growth continues at
2.3%-2.9% per annum, and no active steps
are taken to reduce CO
2
emissions.