


 12 / 72

12
Dairy
products
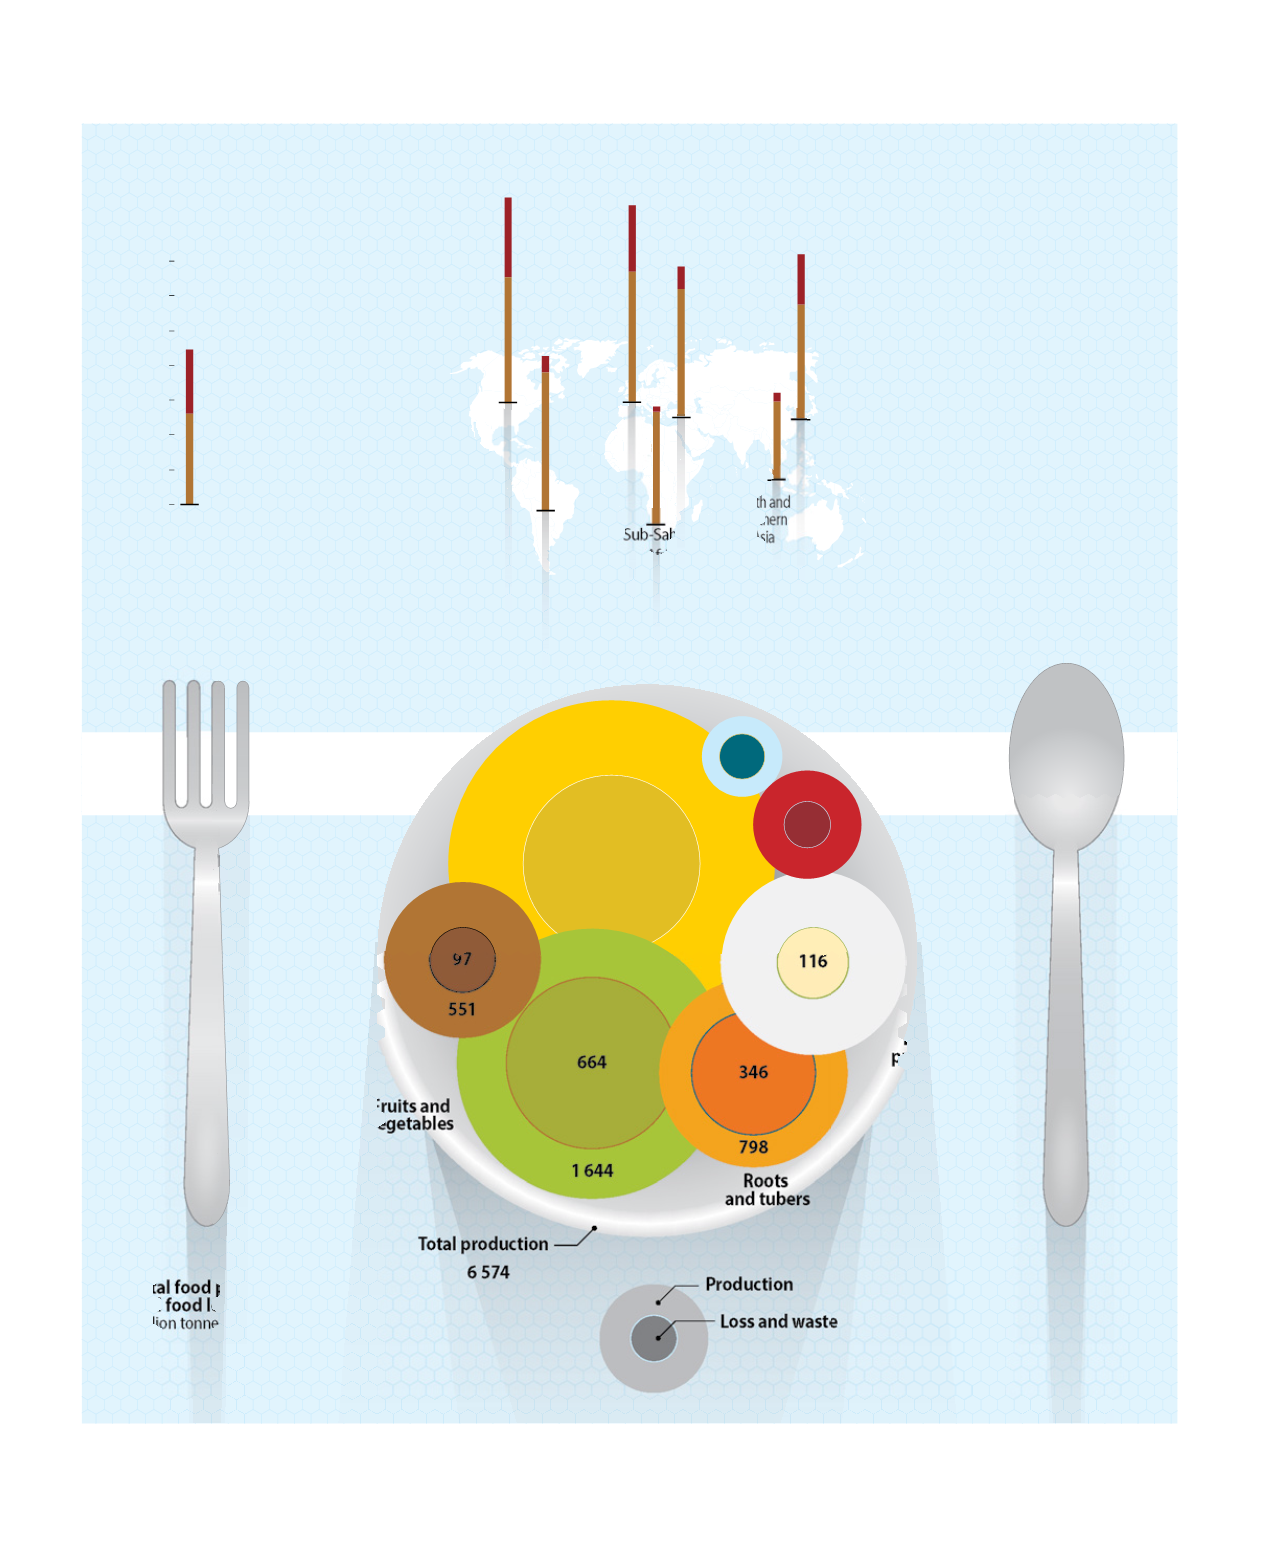
Roots
and tubers
a
Fruits and
vegetables
F
v
Total production
Production
Loss and waste
Oil crops
and pulses
Cereals
Fish
Meat
2 404
798
551
1 644
264
49
146
46
767
116
707
346
97
664
6 574
No
a
North America
and Oceania
No
a
No
a
No
a
Europe
South and
Southern
Asia
Latin
America
Industrialized
Asia
Sub-Saharan
Africa
North Africa,
West and
Central Asia
Per capita food
loss and waste
Kilogrammes per year
Total food production volume
and food loss and waste
Million tonnes
0
50
100
150
200
250
300
350
Production to retail
Consumption