


 10 / 16

10
MULTIFAMILY INVESTMENT PROPERTIES GROUP
| SOUTH FLORIDA
PALM BEACH
MULTIFAMILY MARKET SUMMARY
YEAR $ SALES VOLUME
# OF
SALES
TOTAL #
OF UNITS
ASKING
RENT
ASKING
RENT
PSF
ASKING
RENT
GROWTH
EFFECTIVE
RENT
EFFECTIVE
RENT PSF
EFFECTIVE
RENT
GROWTH
VACANCY
NET
ABSORP
NEW
UNITS
2016 926,878,096
35 67,860 $1,393 $1.38
4.0% $1,355
$1.35
2.1% 4.0% 1,606 1,038
2015 833,436,251
44 66,832 $1,339 $1.33
9.4% $1,327
$1.32
8.9% 4.4% 1,596 2,096
2014 482,599,189
37 64,770 $1,224 $1.22
7.3% $1,218
$1.21
8.2% 3.8% 2,080 2,129
2013 269,892,418
23 62,800 $1,141 $1.13
5.2% $1,126
$1.12
5.5% 4.0% 2,887 2,722
2012 353,381,000
21
60,089 $1,085 $1.09 4.1% $1,067
$1.07
4.5% 4.5% 828 416
2011
279,995,600
14 59,686 $1,042 $1.05
1.6% $1,021
$1.02
2.6% 5.2% 896 710
2010 268,935,358
13 59,010 $1,026 $1.03
1.4% $995
$1.00
2.4% 5.7% 1,172 466
2009 121,138,414
10 58,590 $1,012 $1.02
-3.4% $972
$0.98
-3.3% 7.0% 443 672
2008 100,031,000
9
58,178 $1,048 $1.05
-1.8% $1,005
$1.01
-1.6% 7.1% 61
488
2007 202,600,999
14 57,884 $1,067 $1.08
N/A $1,021
$1.03
N/A 6.9% 254 239
$925 MILLION $26.48 MILLION
$136 PSF
$138,514
2016 Sales
2016 Average Sale Price
YTD Median Sale PSF
YTD Median Sale per Unit
$1,393
96.0%
1,606 UNITS
67,860 UNITS
Average Rent Per Unit
Occupancy Rate
Annual Unit Net Absorption Inventory of Rentable Units
Palm Beach Apartments Under Construction
8
apartment buildings
totaling
1,838
units under construction
in Palm Beach
BUILDING
CITY
# OF
UNITS
EXPECTED
COMPLETION
Boca City Walk
Boca Raton
229 2016
Elan Boca
Boca Raton
378 2017
500 Ocean
Boyton Beach 341
2017
Uptown at Delray
Delray Beach 146 2016
Village at Lake Osborn
Lake Worth
118 2016
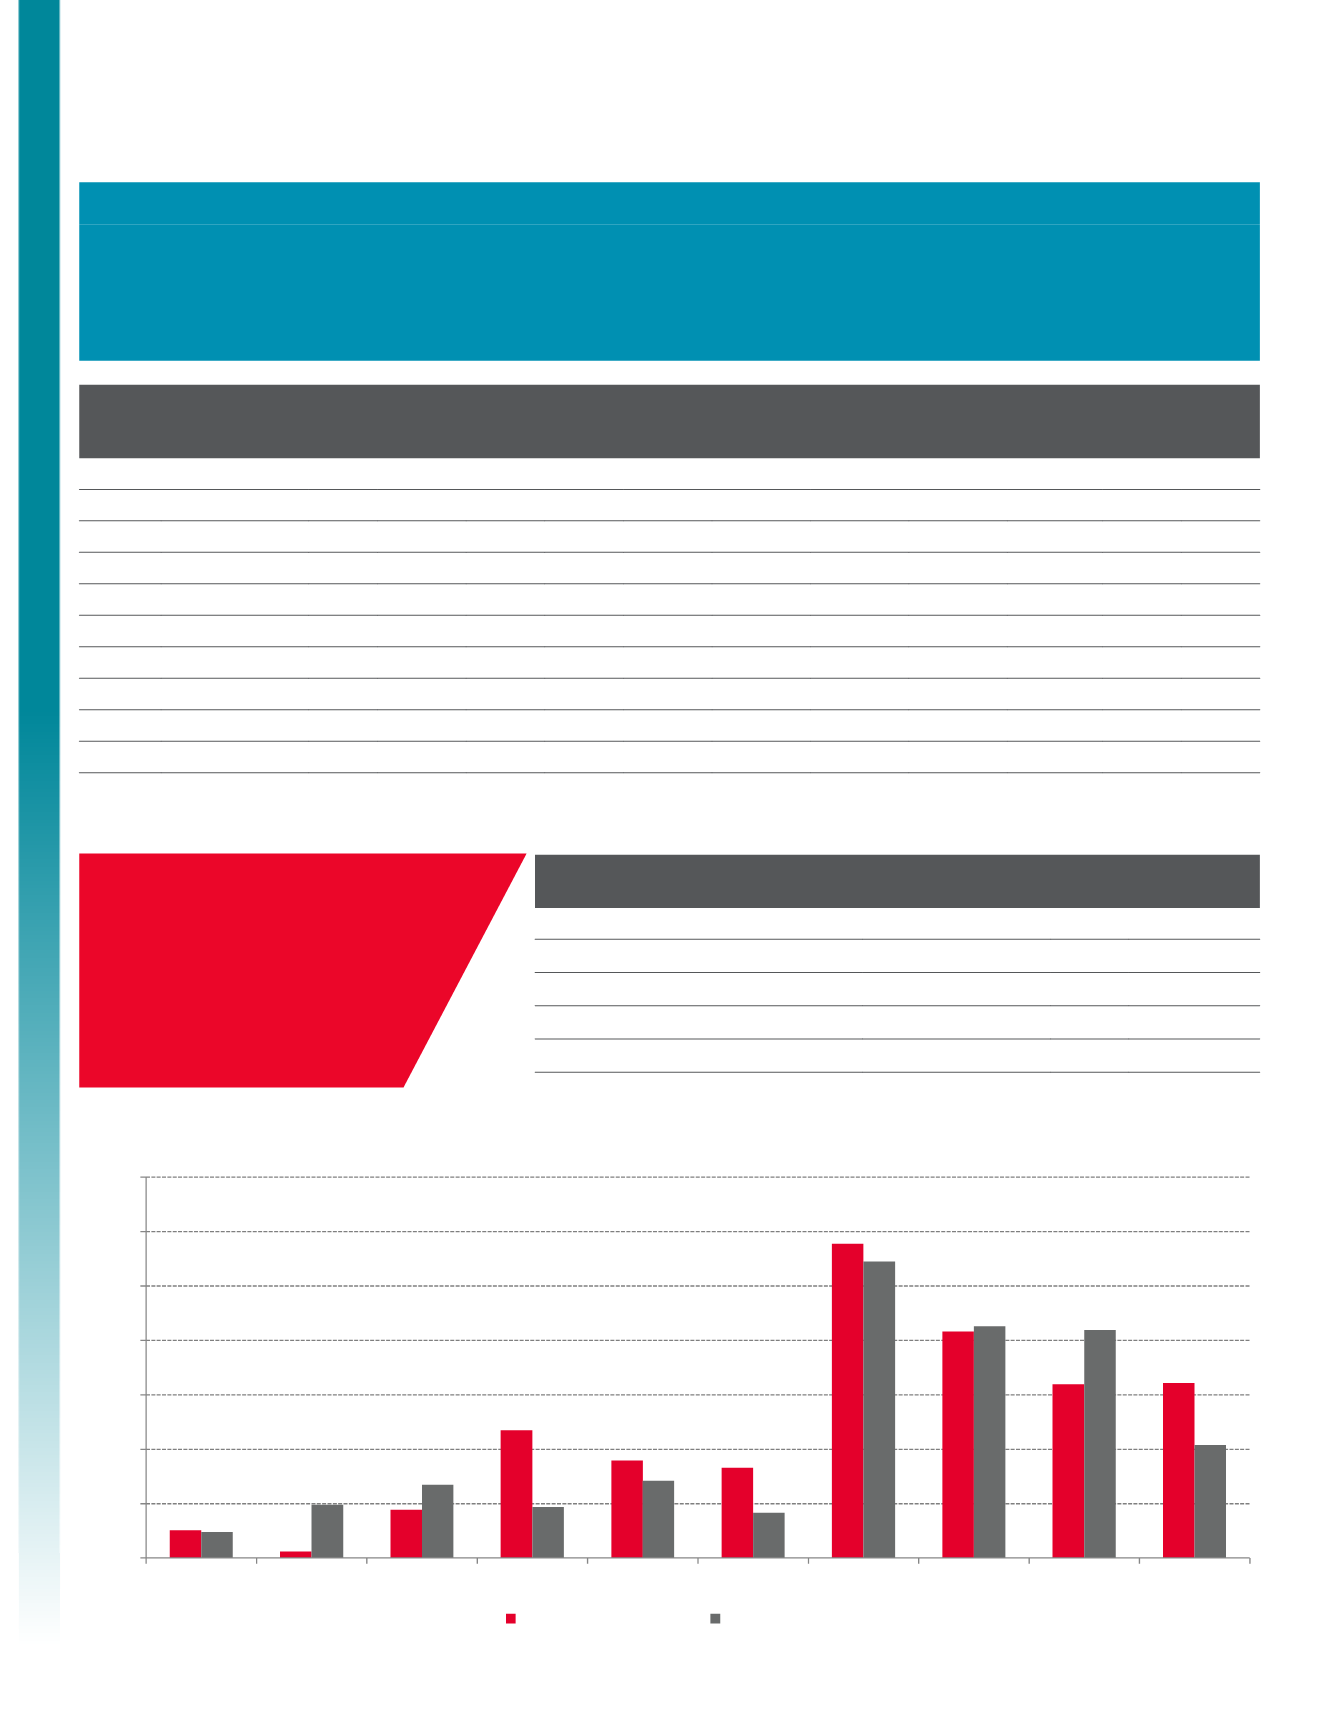
Palm Beach Deliveries Versus Absorption
-500
0
500
1,000
1,500
2,000
2,500
3,000
3,500
4,000
2007
2008
2009
2010
2011
2012
2013
2014
2015
2016
Net Absorption (Units)
Deliveries (Units)
-500
0
500
1,000
1,500
2,0 0
2,500
3,0 0
3,500
2007
2008
2009
2010
2011
2012
2013
2014
2015
2016
Net Absorption (Units)
Deliveries (Units)
0
500
1,000
1,500
2,000
2,500
3,000
3,500
2007
2008
2009
2010
2011
2012
2013
2014
2015
2016
Net Absorption (Units)
Deliveries (Units)