


 116 / 201

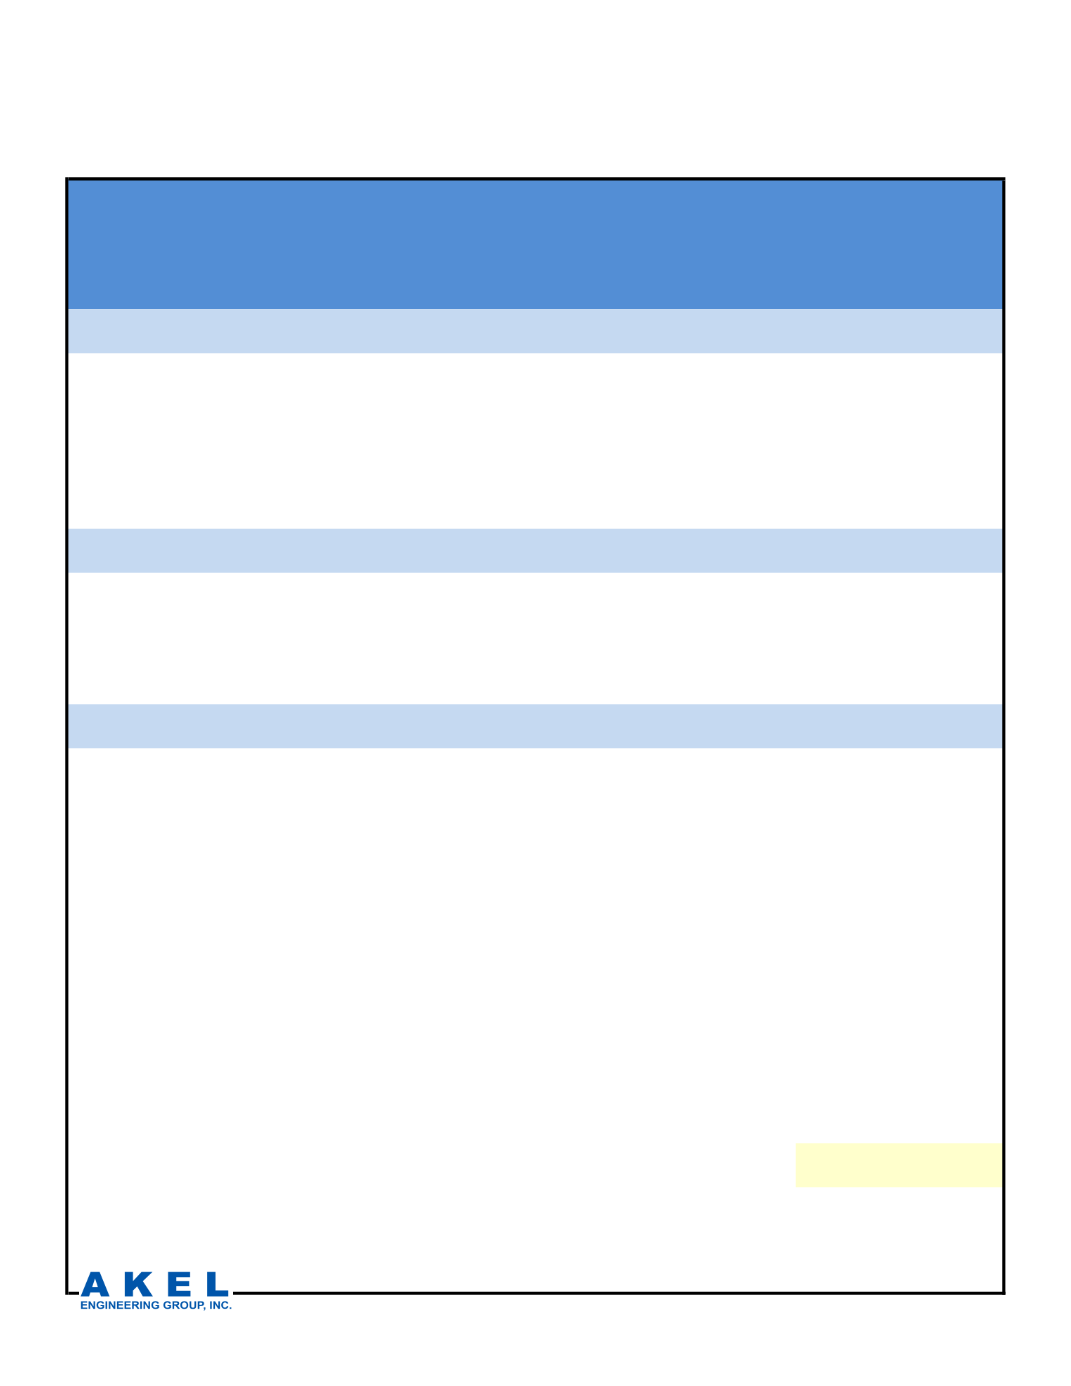
Table 7.1 Supply Capacity Analysis
Water System Master Plan
City of Morgan Hill
PRELIMINARY
Year
2015 2020 2025 2030 2035
(MGD)
(MGD)
(MGD)
(MGD)
(MGD)
Projected Demands - Population Method
Projected Population
42,382
48,000
51,400
54,800
58,200
Average Day Demands
7.6
7.6
8.2
8.7
9.3
Maximum Day Demands
15.2
15.3
16.3
17.4
18.5
Peak Hour Demands
22.8
22.9
24.5
26.1
27.8
Projected Demands - Land Use Method
Average Day Demands
6.0
6.9
7.7
8.5
9.4
Maximum Day Demands
12.0
13.7
15.4
17.1
18.8
Peak Hour Demands
18.0
20.6
23.1
25.6
28.2
Supply vs. Demand Analysis
Available Supply
2015 Available Total Supply
19.32
-
-
-
-
2015 Available Firm Supply
17.16
-
-
-
-
Required Supply
Meet Maximum Day Demand with Firm Supply
15.2
15.3
16.3
17.4
18.5
Surplus / Deficiency
With Existing Firm Supply
2.0
1.9
0.8
-0.3
-1.3
With Recommended Total Supply
2.0
1.9
0.8
0.9
1.0
Recommended New Supply
Recommended Staged Upgrade
1 New Well 1 New Well
Assumed Typ. Future Well Capacity at 1.15 MGD
1.2
1.2
Recommended Total Supply
17.2
17.2
17.2
18.3
19.5
2/8/2017
Demand and Supply