


 7 / 40

Chemical Technology • October 2015
PETROCHEMICALS
5
COVER STORY
samples are compared with samples from the spill sites.
‘Full scan’ is useful in determining unknown compounds in
a sample. Since the mass spectrum produced by a given
chemical compound is essentially the same every time,
the mass spectrum is essentially a ‘fingerprint’ for the
molecule. This ‘fingerprint’ can therefore be used to identify
the compound [1].
Denver explained that, in order for a compound to be
analysed by GC-MS it must be sufficiently volatile and
thermally stable. Samples are usually analysed as or-
ganic solutions; as a result, materials of interest need to be
solvent-extracted and the extract subjected to various ‘wet
chemical’ techniques before GC-MS analysis is possible. For
example, SVOCs such as phenols and PAHs will be subject
to liquid-liquid sample extraction.
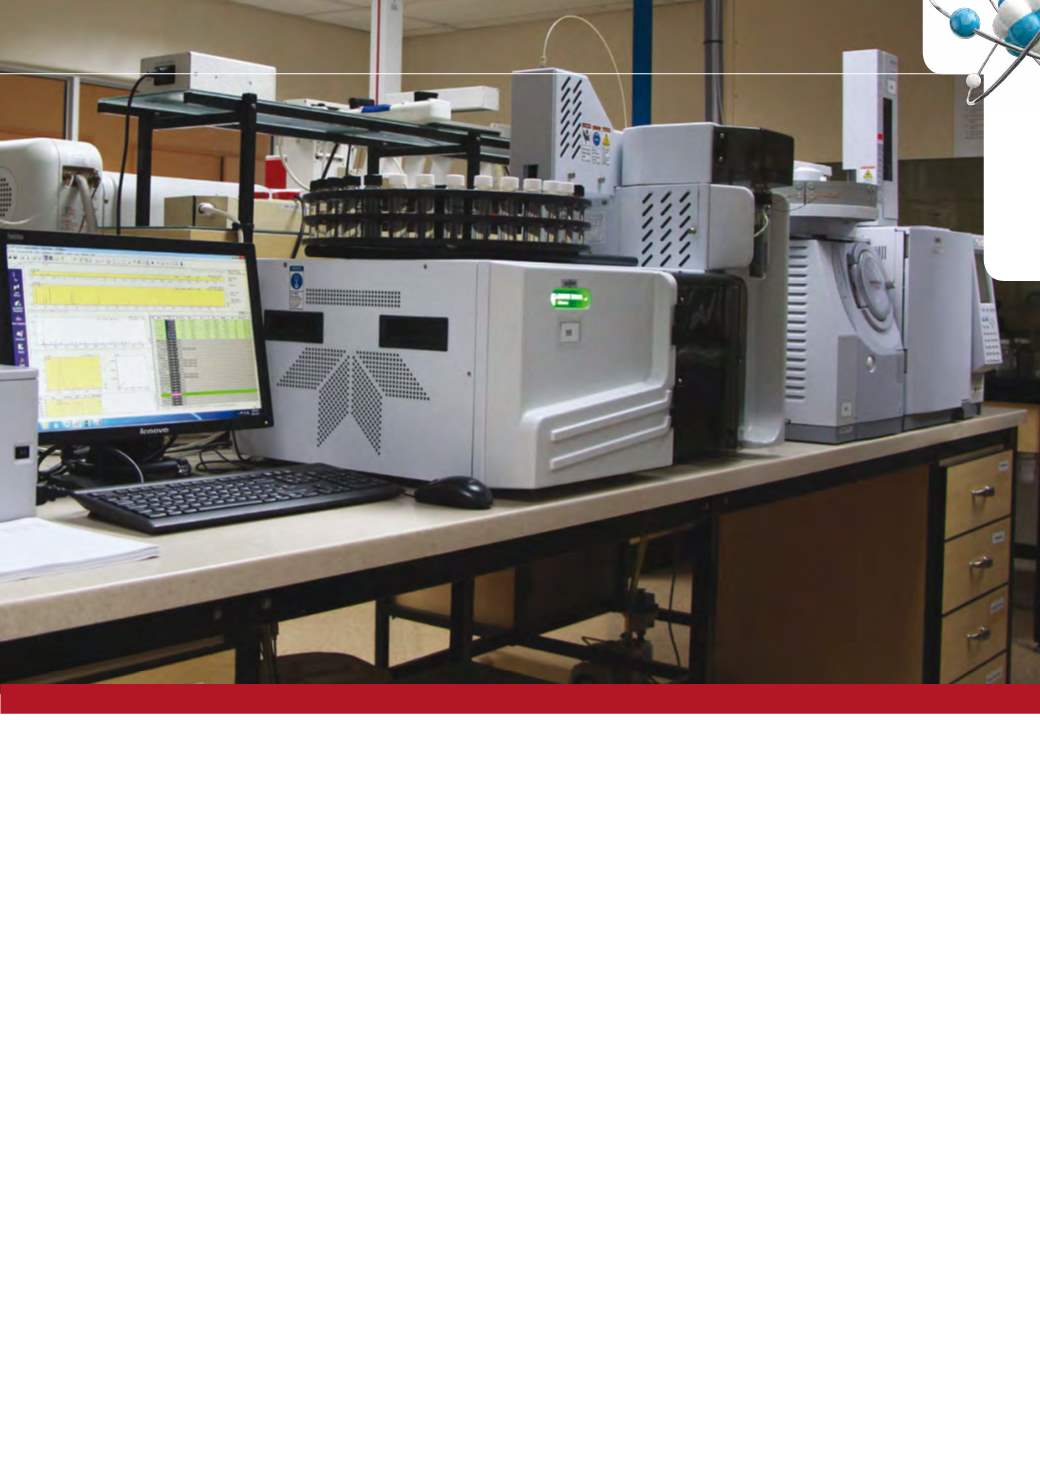
The sample solution is then injected into the GC inlet
where it is vaporised and swept onto a chromatographic
column by the carrier gas. The sample flows through the
column and the compounds comprising the mixture of
interest are separated [2].
The next component (the mass spectrometer/analyser)
separates the, by-then positively charged, ions according
to various mass-related properties. After the ions are sepa-
rated they enter a detector which sends information to a
computer which, aside from controlling the operation of the
MS, also records all of the data produced and converts the
electrical impulses into visual and/or hard copy displays [2].
In other words, the MS produces mass spectrum pat-
terns from which chromograph plots are generated. The
analyst looks at each of the chromatograms, overlays the
plots (from the various samples that have been analysed),
in order to identify all of the peaks that are in the samples.
The peaks are measured in relation to one another. The
tallest peak is assigned 100 % of the value, and the other
peaks assigned proportionate values. The total mass of the
unknown compound is normally indicated by the parent
peak. A ‘full spectrum’ analysis considers all the ‘peaks’
within a spectrum [1].
After identifying the peaks, the analyst will check to see
if there are any matching patterns. Most volatile compounds
show up first, Denver explained, and heavier compounds
later. This enables very accurate identification of where
that sample may have come from. Molecular masses of
each compound are visible on the chromatograms. If nec-
essary, the analyst can also do a computer library search,
to match spectrum patterns of compounds stored in an
electronic database.
Denver said that quantitative methods analysis can be
done at a later stage, based on the findings of the initial
GC-MS scan analysis. Many test methods are available at
the ERWAT Laboratories whereby a wide range of organic
compounds can be quantified, depending on what has
been identified in the scans. Techniques available now are
extremely sensitive, indicating low parts per billion.
For more information
telephone +27 11 929 7014/7000;
email:
laboratory@erwat.co.za/mail@erwat.co.za.References
1.
www.gmu/depts/SRIF/tutorial/gcd/gc-ms2.htm2.
http://www.bris.ac.uk/nerclsmsf/techniques/gcms.html