


 8 / 56

6
One Model, Many Interests, Many Views
Representing Requirements
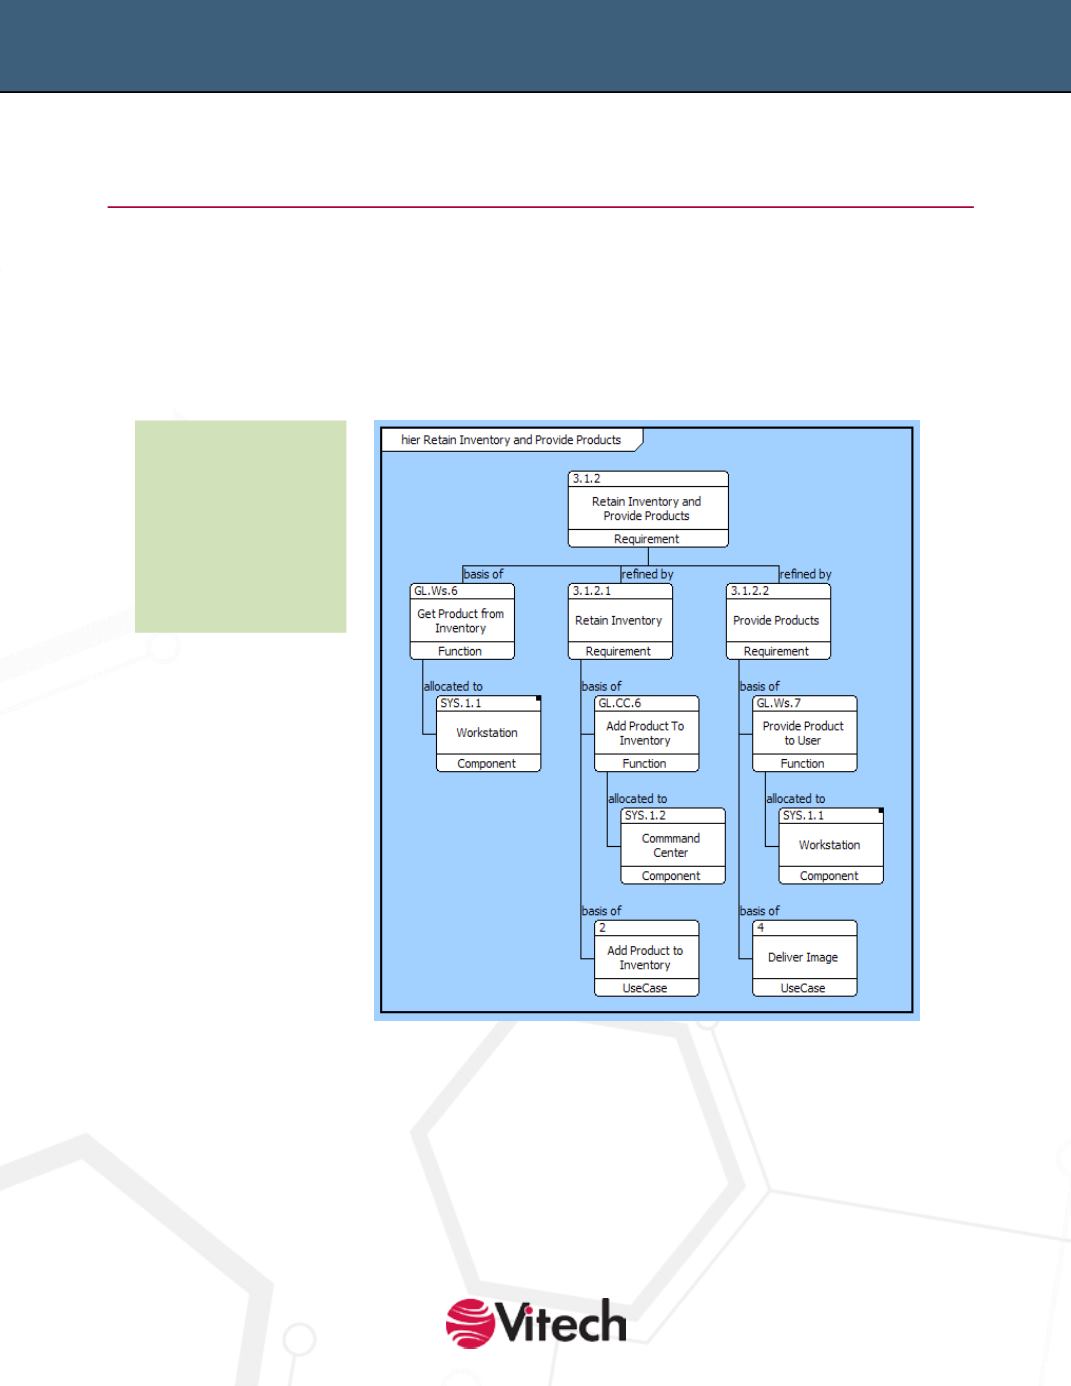
Hierarchy Diagram
The hierarchy diagram – one of the oldest and most used systems engineering graphical views –
represents relationships between several layers or types of elements. There is no pre-defined semantic
for a hierarchy, allowing the creator to define the specific set of relationships to deliver the desired
representation and insight. Sample uses include representing requirements hierarchies as well as
functional composition, physical composition, and traceability across the design.
A hierarchy diagram is based on the combination of a root element and a set of relationships to display.
The root element defines the starting point for the diagram and is classically shown as a node on the
top (in a top-down representation) or left (in a left-to-right representation). Individual elements are
shown as nodes with the relationships between the elements shown as connecting lines. Classically, the
information content is kept to a minimum with nodes showing element names and perhaps number,
type, or class (although any information can be displayed, as desired). The emphasis in a hierarchy
diagram is on interrelationships, with connecting lines frequently labeled to clearly communicate the
nature of the relationship between the elements unless the diagram only shows composition (a pure
hierarchy of requirements, functions, or components).
Level of Detail:
Low
Audience:
General
Content:
Names and
relationships
Use:
Multi-level
decomposition of
requirements