


 9 / 56

7
One Model, Many Interests, Many Views
Individual nodes can be expanded or collapsed to show additional relationships or hide additional detail
as desired to enhance the communication value of the diagram. When a node is collapsed, a black
square is placed in the upper-left corner of the node as an indicator that there are more relationships
which have not been shown. When an element occurs multiple times on the same diagram (as with
“Workstation” in the sample hierarchy diagram), a black square is frequently placed in the upper-right
as a cue to the reader.
Because of its classic format and the absence of any specialized symbology, the hierarchy diagram is
well-suited for all types of audiences. The information content is intentionally kept low to maintain
focus on the interrelationships between system elements – composition, traceability, or both. At its
core, the hierarchy diagram represents a generic visual query with no defined semantics.
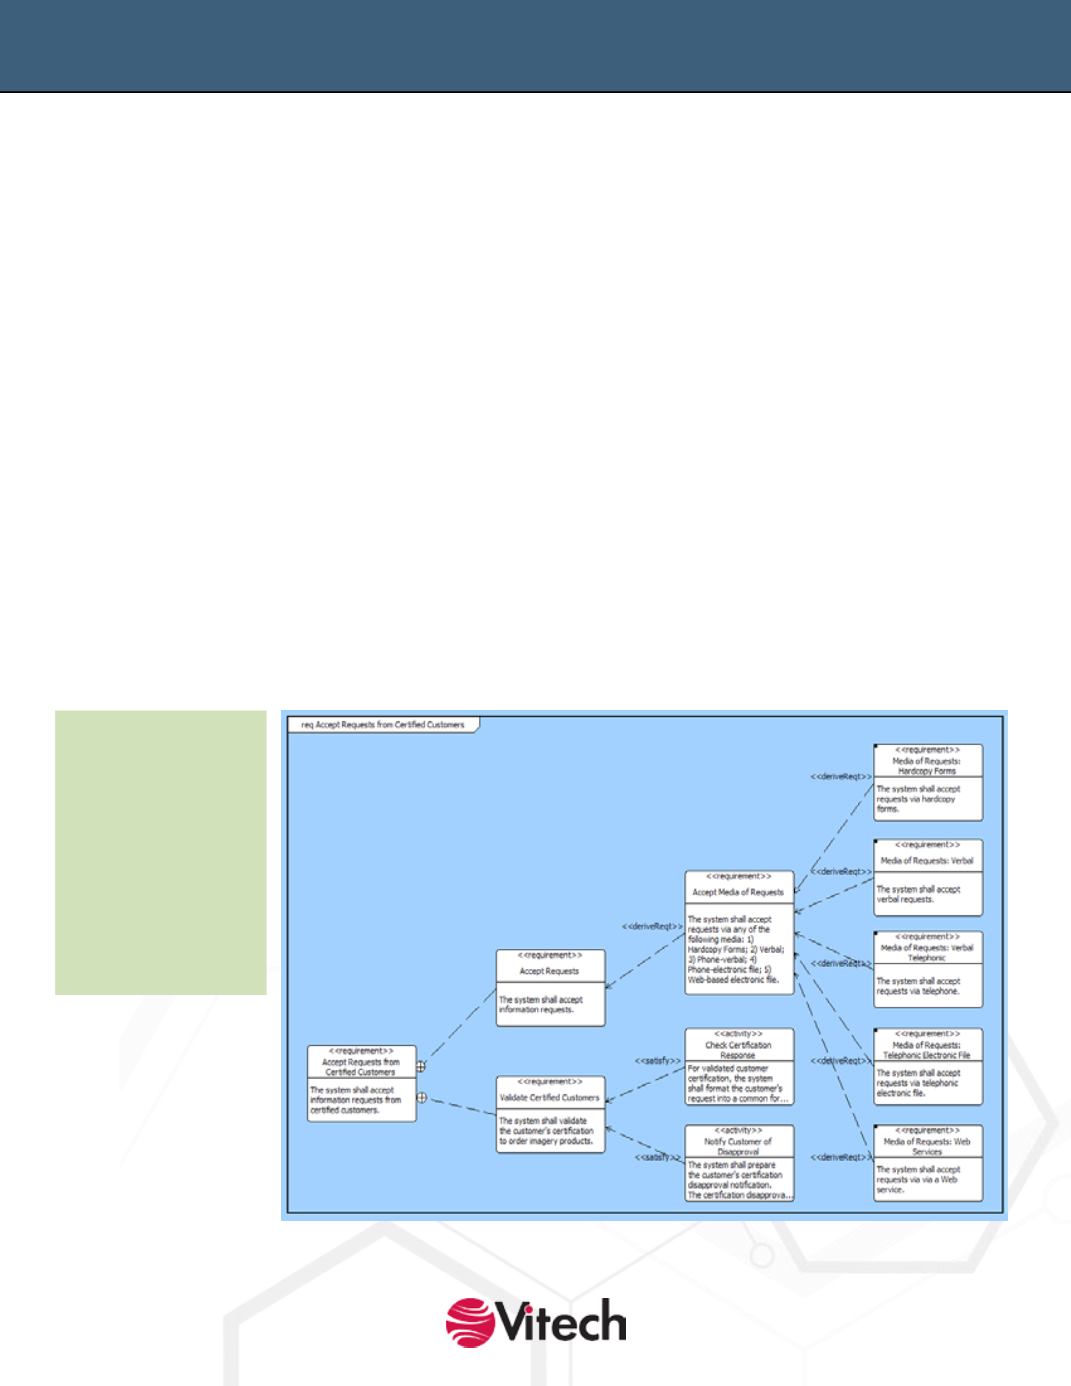
Requirement Diagram
The requirement diagram is a SysML extension of the classical hierarchy diagram standardizing the
representation of key aspects of requirements – notably decomposition into child requirements
and traceability to system elements that satisfy or verify the given requirement. To convey greater
information, diagram nodes often show the element description. As a result, requirement diagrams
quickly become quite large and therefore are frequently limited to display context for just a handful
of requirements. Recognizing this, requirement diagrams are frequently complemented with a tabular
representation.
Level of Detail:
Medium
Audience:
System/
software engineers
Content:
Names,
relationships, and
descriptions
Use:
Context for
limited set of
requirements