


 14 / 72

14
The criminal groups involved in illegal logging also damage
local communities through loss of income and livelihood, life
threatening environmental damage, corruption of officials,
fraud, money laundering, extortion, threats of violence, and
even murder (INTERPOL 2009; Hiemstra van der Horst 2011).
It is clear that, in spite of certification and management ef-
forts, illegal logging has not stopped. Indeed it has remained
high in many regions including the Amazon, Central Africa
and Southeast Asia. In some areas, it has actually increased
in recent years.
With the billion dollar investments in REDD+ and a develop-
ing carbon trade market designed to facilitate further invest-
ments in reducing emissions, illegal international cartels and
networks pose a major risk to emission reductions and cli-
mate change mitigation through corruption and fraud, while
also jeopardizing development goals and poverty alleviation in
many countries.
In the mid-2000s, some countries, like Indonesia, experienced
what appeared to be a decline in illegal logging following in-
creased enforcement efforts, arrests and even logging morato-
riums. However, what became apparent was that a decline in
logging in parts of Indonesia triggered an increase in demand
elsewhere, such as in the Papua New Guinea, Myanmar and
the Greater Congo Basin (UNEP 2011). Indeed, as demand for
timber or wood products is rising in many countries, includ-
ing China (which is expected to almost double its wood con-
sumption by 2020 with world demand for timber expected
to increase by 70 per cent by 2020) (INTERPOL-World Bank
2009; UNEP 2009), a reduction in logging in one geographic
location will be offset by increased logging in another.

Another critical issue is that most illegal logging takes place
in regions characterized by conflict or widespread corruption.
There are advanced corruption schemes in many tropical for-
est regions, including the Amazon Basin, the Congo Basin,
Southeast Asia and Indonesia. Enforcement efforts during the
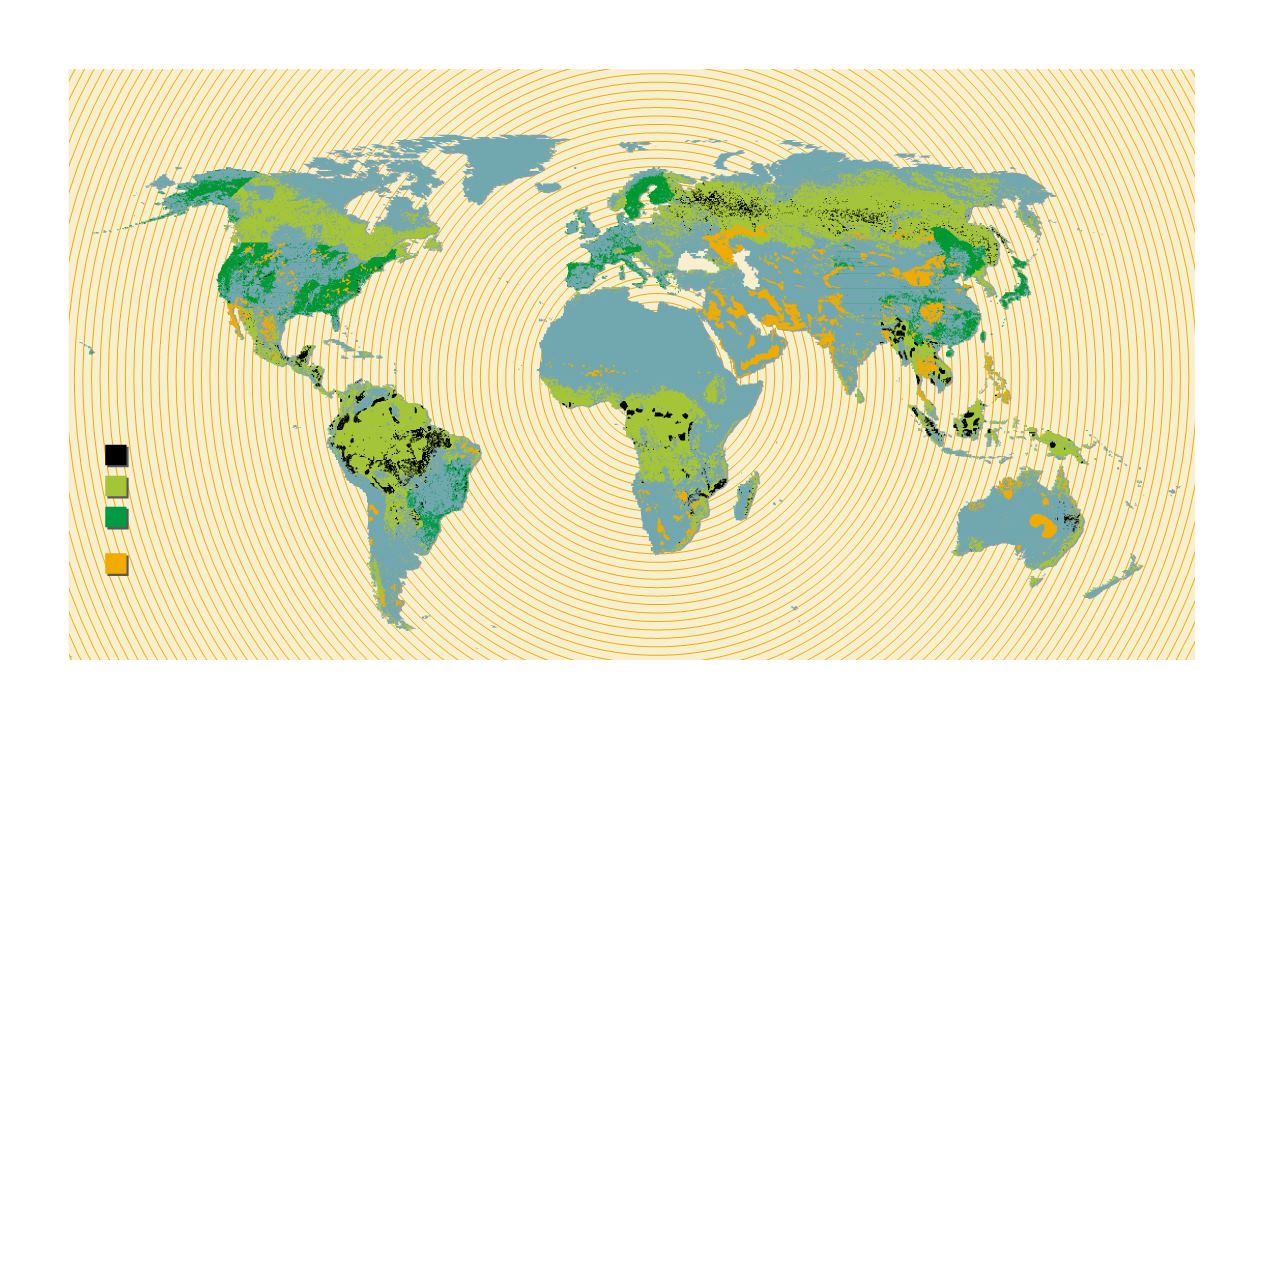
Net loss of forest
Net gain of forest
Dryland degradation
The health of our forests
Current forest cover
Source: Adapted from a map by Philippe
Rekacewicz originally published in UNEP-FAO
Vital
Forest Graphics
, 2009; data source from MA 2005.