


 74 / 112


74
- -
-
-
-
-
-
-
-
-
-
-
-
-
-
-
-
-
-
- -
-
-
- -
- -
-
-
- -
-
- -
-
-
-
-
-
-
-
-
-
-
-
-
-
-
-
-
-
-
-
-
-
-
-
-
-
-
-
-
-
-
-
-
-
-
- -
-
-
-
-
-
-
-
-
-
-
-
-
-
-
-
- -
-
-
-
-
-
-
-
-
-
-
-
-
-
-
-
-
-
- -
-
-
- -
- -
-
-
- -
-
- -
-
-
-
-
-
-
-
-
-
-
-
-
-
-
-
-
-
-
-
-
-
-
-
-
-
-
-
-
-
-
-
-
-
-
- -
-
-
-
-
-
-
-
-
-
-
-
-
-
-
-
- -
-
-
-
-
-
-
-
-
-
-
-
-
-
-
-
-
-
- -
-
-
- -
- -
-
-
- -
-
- -
-
-
-
-
-
-
-
-
-
-
-
-
-
-
-
-
-
-
-
-
-
-
-
-
-
-
-
-
-
-
-
-
-
-
- -
-
-
-
-
-
-
-
-
-
-
-
-
-
-
-
- -
-
-
-
-
-
-
-
-
-
-
-
-
-
-
-
-
-
- -
-
-
- -
- -
-
-
- -
- -
-
-
-
-
-
-
-
-
-
-
-
-
-
-
-
-
-
-
-
-
-
-
-
-
-
-
-
-
-
-
-
- -
-
-
-
-
-
-
-
-
-
-
-
-
-
-
-
- -
-
-
-
-
-
-
-
-
-
-
-
-
-
-
-
-
-
- -
-
-
- -
- -
-
-
- -
-
- -
-
-
-
-
-
-
-
-
-
-
-
-
-
-
-
-
-
-
-
-
-
-
-
-
-
-
-
-
-
-
-
-
-
-
- -
-
-
-
-
-
-
-
-
-
-
-
-
-
-
-
0
5 000
4 000
3 000
2 000
1 000
6 000
7 000
8 000
9 000
10 000
11 000
12 000
13 000
Source: R. Costanza
,
The value of the world’s ecosystem
services and natural capital
,
Nature, 1998.
Open ocean
Sea grass -
Algae bed
Other coastal
biomes
Shelf
Lakes -
Rivers
Wetlands
Tropical forest
Rock and ice
Grasslands
Croplands
Temperate and
Boreal forest
Coral reef
Estuaries
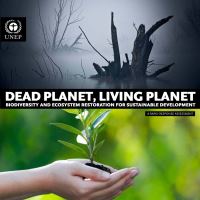
Ecosystem services value
Bilion of US dollars per year,
adjusted to 2010 inflation rate
uncertain
data
Figure 14:
The values of ecosystem services (Costanza
et al
, 1998).
However, while there is general public recognition of the benefits
of restoration, policymakers needs to become more aware of the
financial aspects associated with either conservation (where pos-
sible), restoration or, ultimately, continued degradation or loss of
ecosystem services. In general the cost of conservation lies around
500 USD/ha on average (range 0.01–1,000 USD/ha/year), com-
pared to a few thousand to up to several hundred thousand USD/
ha in restoration costs for the same areas. These costs, however, are
dwarfed by the cost of the services provided over decades, which
amount to tens of thousands and even millions of dollars per ha.
It is in simple terms much more financially profitable to protect
than to restore where possible, but even restoration compared to
loss provides a benefit/cost ratio of 3–75 in return of investments
and an internal rate of return of 7–79%. Thus, avoiding loss of eco-
systems by initial conservation, particularly of forests, mangroves,
wetlands and the coastal zone, including coral reefs, should be a
primary objective from a cost-benefit analysis (Dodds
et al
., 2008).
As large shares of the world’s ecosystems are already degraded
or even lost, ecosystem restoration provides a low-risk, benefi-
cial, cost-effective and financially sound investment providing
excellent internal rates of return – and with high public aware-
ness and support. The implementation, however, requires
broad multi-sectoral and multi-staker involvement to ensure
proper success. This relates also to careful consideration to
payer-systems and public-private partnerships (Holl and How-
arth, 2000), as multiple sectors will benefit.
The cost of conservation and required management, while
highly variable, is typically USD 0.01–1,000 per hectare per
year, commonly around 10–15 USD/ha/year (). In comparison,
the cost of restoration is from a few hundred dollars to 554,000
USD/ha for coral reefs as the most costly (TEEB, 2008, high
scenario), compared to annual benefits from ecosystem servic-
es of 1,010 USD/ha/year to 129,200 USD/ha/year.
A survey of 62,108 river restoration projects in the US report-
ed a total spending of 1.6 billion USD or an average of 25,761
USD per river (O’Donnell and Galat, 2007), with water quality
improvement as the most common primary purpose. In com-
parison, 7.8 billion USD was invested in restoring the Florida
Everglades ecosystem. It is however also important to moni-
tor the effect of the investments and compare lower-intensity
restoration with intensive restoration measures to evaluate the