


 76 / 112


76
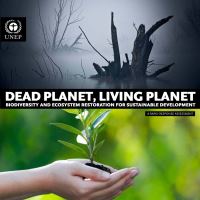
Figure 15:
Ecosystem restoration cost ranges.
Thousands Euro per hectare (logaritmic scale)
Ecosystem restoration cost ranges
1
10
0,1
0,01
0
100
1 000
10 000
Grassland -
Rangeland
Temperate
forest
Tropical
forest
Inland
wetlands
Lake and
rivers
Woodland -
shrubland
Marine
Coastal
systems
Coral
reefs
Source: TEEB,
The Economics of Ecosystems and Biodiversity for National
and International Policy Makers,
2009
.
most optimal benefit-cost ratio (Frimpong
et al
., 2006). Resto-
ration of coastal ecosystems in the Biscayne Bay, Florida, from
invasions of exotic damaging plants is another good example
of success. The annual benefit of restoration was estimated at
1.7 million USD, giving a long-term value of some 41 million
USD. The costs of the restoration projects were approximately
16 million USD. This gave a net gain of 41 million USD, with
an internal rate of return of 11% (Lee and Bwenge, 2009).
Worldwide, 8–10 billion USD are invested annually in con-
servation, mainly in protected areas (James
et al
. 2001, Pearce
2007). It has been estimated that for an annual investment of
around 45 billion USD per year into protected areas alone could
secure ecosystem services worth an estimated five trillion USD
(Balmford
et al
., 2002; TEEB, in press). In the US, the total val-
ue of ecosystem services provided by the refuge system likely
exceeds the value derived from pure recreational activities, and
is estimated at around 26.9 billion USD annually (Ingraham
and Foster, 2008). In Menglun, Xishuangbanna, Southwest
China, loss of ecosystem services from deforestation to clear
for rubber plantations was estimated at 11.4 million USD or
27% across 18 years (Hu
et al
., 2008).