


 18 / 36


18 |
Ten-Year Network Development Plan 2017– Executive Summary
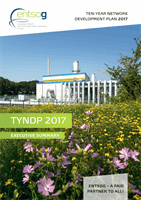
Figure 4.2:
Supply Adequacy Outlook
0
5,000
4,000
3,000
2,000
1,000
6,000
7,000
TWh/y
0
500
400
300
200
100
600
700
bcma
National Production (NP)
Demand Green Evolution
NP – Biomenthane
Demand EU Green Revolution
Demand Blue Transition
Blue Transition + Exports
Minimum Supply Potential
Maximum Supply Potential
2017
2020
2025
2030
2035 2037
0
6,000
7,000
4,000
5,000
3,000
2,000
1,000
TWh/y
Balanced AZ Max
LNG Min
LNG Max
RU Max
RU Min
National Production (NP)
Azerbaijan (AZ)
LNG
Norway (NO)
Russia (RU)
Algeria (DZ)
Libya (LY)
Figure 4.3:
Green Evolution: Sources per supply mix – 2030
The TYNDP assessment results show, by looking at the 2017 situation, that the
current infrastructure already achieves many of the aims of the internal energy mar-
ket except in some specific areas. To investigate the investment needs on the long-
er term, it looks at what the FID projects (representing 34 items, the majority of
which are planned to be commissioned by 2020) will already allow to deliver in
terms of security of supply, market integration and competition over the 20 next
years, taking into consideration the evolution of the gas demand seen in the differ-
ent scenarios.
It concludes that FID projects already significantly improve the current situation, in
particular in the South-Eastern part of Europe, but that in other areas addressing the
infrastructure needs will require additional projects.
Supply Adequacy is not at stake, maintaining its diversification is the challenge
Over the coming years, European indigenous natural gas production is set to decline
in a number of countries, in particular in the Netherlands where the depletion of the
Groningen field is under close monitoring by the authorities.
In a context where achieving the EU climate targets could result from either an
increase or decrease of gas demand by 2030, this implies that European supply
needs are foreseen to increase or at best stay stable.
The TYNDP assessment shows that the supply-and-demand balance can be
achieved at European level and that, from an infrastructure perspective, Europe can
accommodate a wide spectrum of supply mixes.
The situation differs when considering areas (parts of Belgium, France and Germa-
ny) supplied with low calorific gas (L-gas). These areas face a declining production
(Groningen and German L-gas fields) while L-gas cannot be directly substituted with
high calorific gas (H-gas) at consumer level. For the concerned areas, this will
require to start in parallel the connection of L-gas areas to the H-gas network and
the conversion of consumers to H-gas. This specific situation, whilst not covered in
detail in this TYNDP, is assessed in the North-West Gas Regional Investment Plan
(NW GRIP) to be published shortly after this TYNDP.