


 15 / 24

 OVERVIEW
TECH METRICS
OVERVIEW
TECH METRICS
15
THE TECH 25•
The New York metropolitan division has the most tech workers at almost 329,000, although its percentage to total nonfarm
jobs is below the U.S. average at 4.8%.
•
On a percentage basis, the number one growth market isn’t much of a surprise, but the sheer size of the jump may be — San
Francisco/San Mateo, CA tech positions have grown by 104.7% over the past 10 years. The number two market might be an
eye-opener — Madison, WI tech positions have increased by 52.2% over the past 10 years. And though still a relatively small
percentage of the overall workforce, Nashville, TN has recorded an incredibly strong 40.4% rise in tech employment over the
same time period.
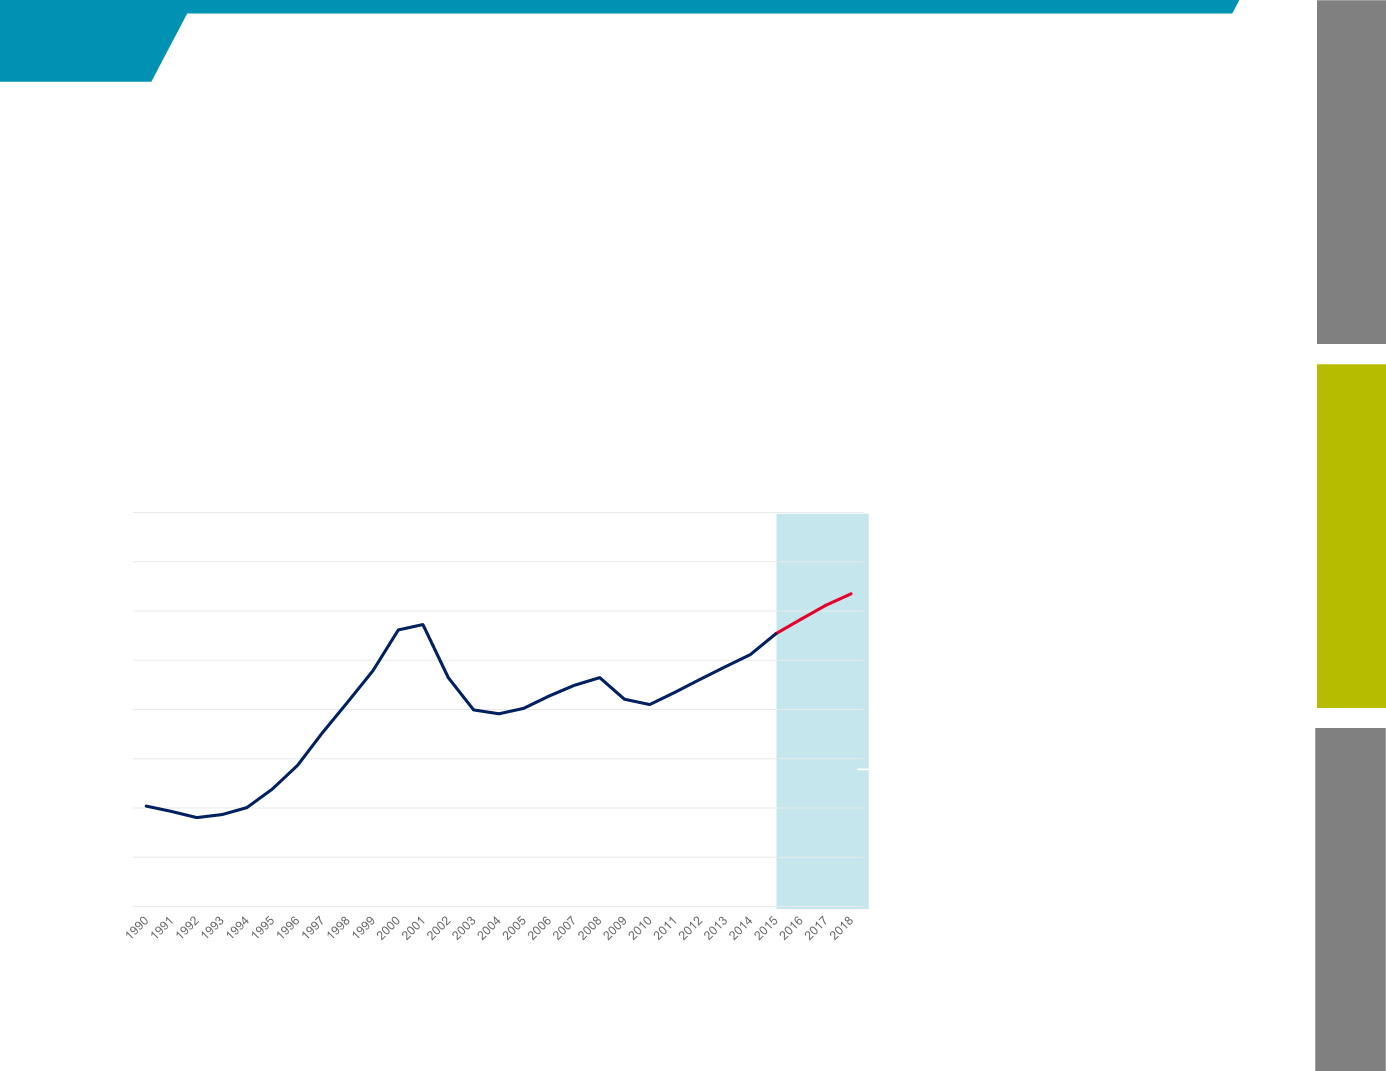
TECH WORKERS IN THE U.S.
Source: BLS, Moody’s Analytics
7.18
4.0
4.5
5.0
5.5
6.0
6.5
7.0
7.5
8.0
Millions
Forecast
The number of tech
workers in the U.S. is
expected to climb above
for the first time in 2017,
beating the previous
record of 6.9 million
in 2001.
7.0
million
Tech Workers