


 20 / 24

20
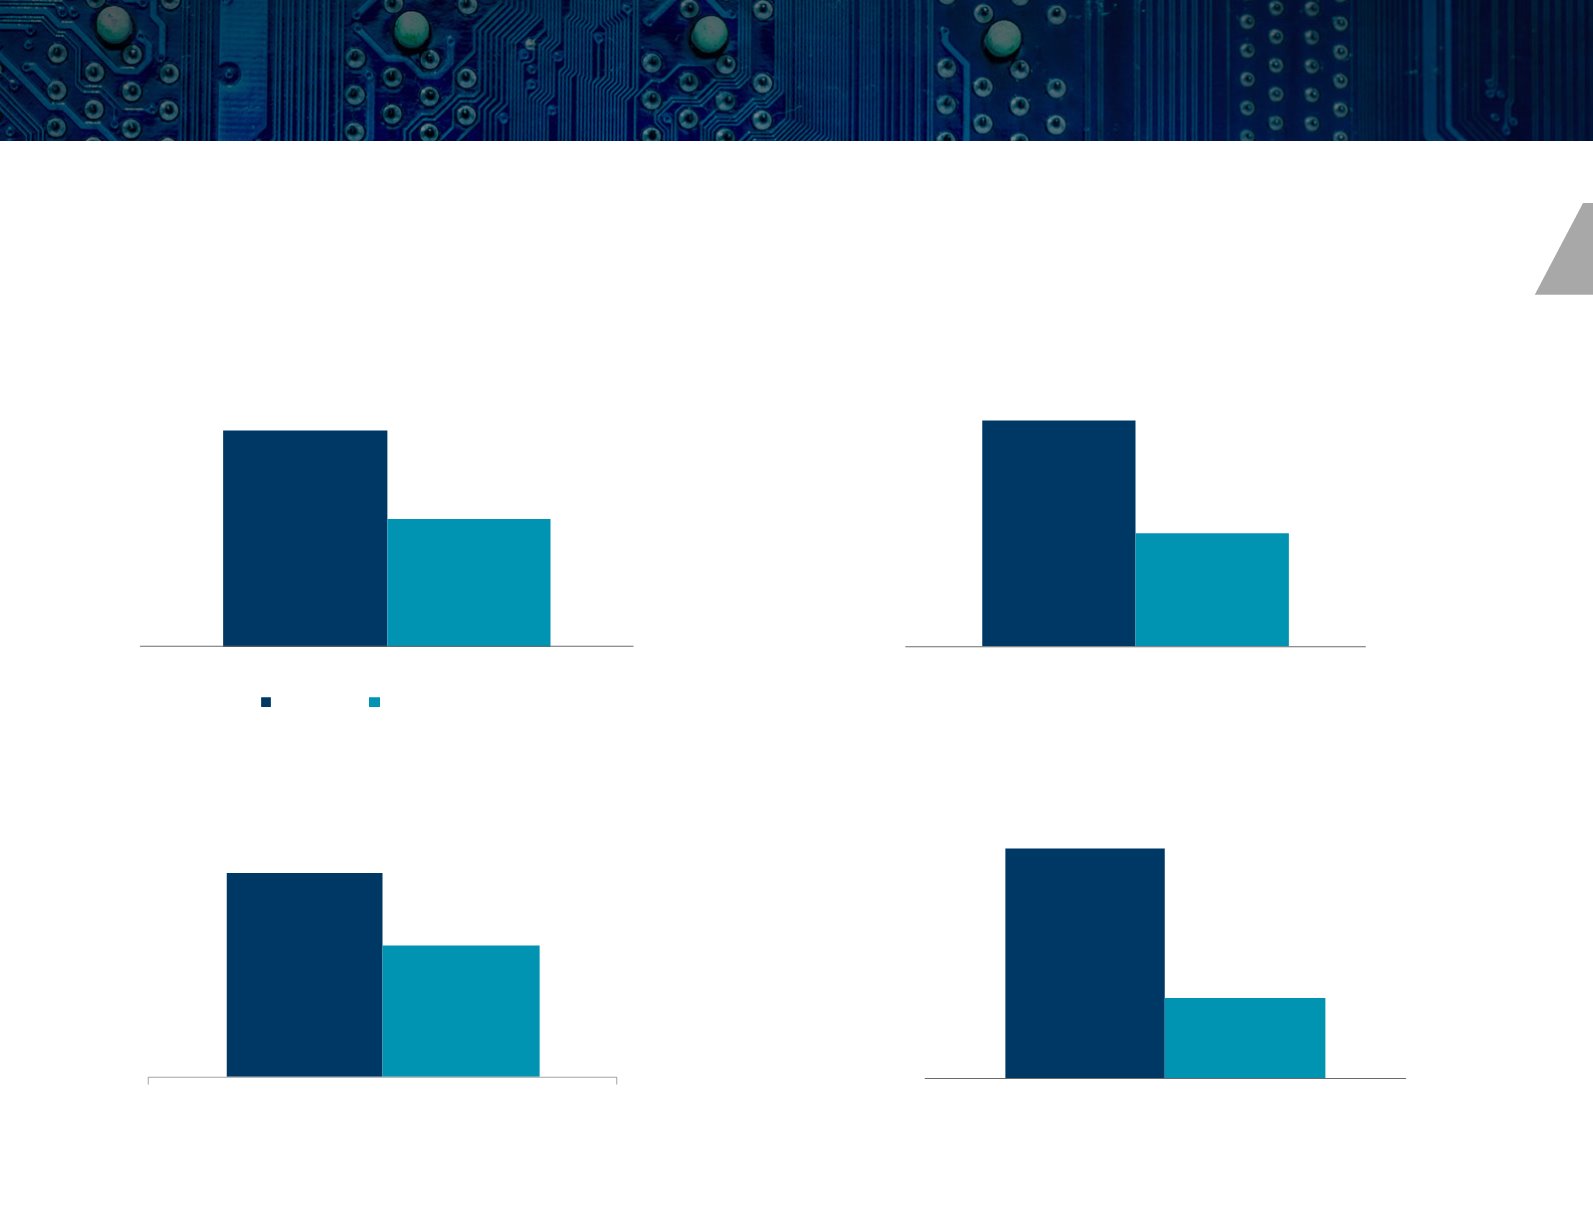
EMPLOYMENT GROWTH SINCE 2009
OCCUPANCY CHANGE SINCE 2010
ABSORPTION SINCE 2010
RENT GROWTH SINCE 2010
Source: U.S. Bureau of Labor Statistics, Cushman & Wakefield
2.2%
1.7%
1.0%
1.2%
1.4%
1.6%
1.8%
2.0%
2.2%
2.4%
2009 - 2017
Tech 25 All Other Markets
233
116
0
50
100
150
200
250
Q2 2010 - Q1 2017
Millions of square feet
Tech All Other Markets
5.0%
3.2%
0.0%
1.0%
2.0%
3.0%
4.0%
5.0%
6.0%
Q2 2010 - Q1 2017
Tech 25 All Other Markets
29.4%
11.0%
1.0%
6.0%
11.0%
16.0%
21.0%
26.0%
31.0%
Q2 2010 - Q1 2017
Tech All Other Markets
The following charts provide a snapshot of how key CRE fundamentals for the tech markets identified in this report (Tech 25)
have stacked up against all other U.S. markets. Overall, since 2009, the Tech 25 have outperformed markets across the U.S.
Tech 25 vs. U.S. Markets
Stronger job
growth among
the Tech 25
Change in
occupancy
greater within
the Tech 25
Tech 25 has
recorded
a sharper
increase in
occupancy
Asking rents up
much more within
the Tech 25