


 9 / 24

 OVERVIEW
TECH METRICS
OVERVIEW
TECH METRICS
9
THE TECH 25•
Top investments by industry in 2016 were software, pharma & biotech, health care devices & supplies,
commercial services, and health care services & systems.
•
Regarding funding stages, it was somewhat of a mixed bag:
--
The average VC round for the angel/seed category has climbed each year since 2011; the number of deals,
however, did decline from 2015 to 2016.
--
The average size of early-stage VC funding climbed in 2016 as well; like the angel/seed category above, though,
the number of deals declined.
--
Regarding later stage VC funding, both the average size of the deal and the number of deals declined in 2016.
It was the first year-over-year decline in size since 2013.
•
VC-backed exits were down from 2015 to 2016 across all major methods — whether acquisition, IPO, or buyout.
Total exits fell to 1,152 from 1,507 year-over-year.
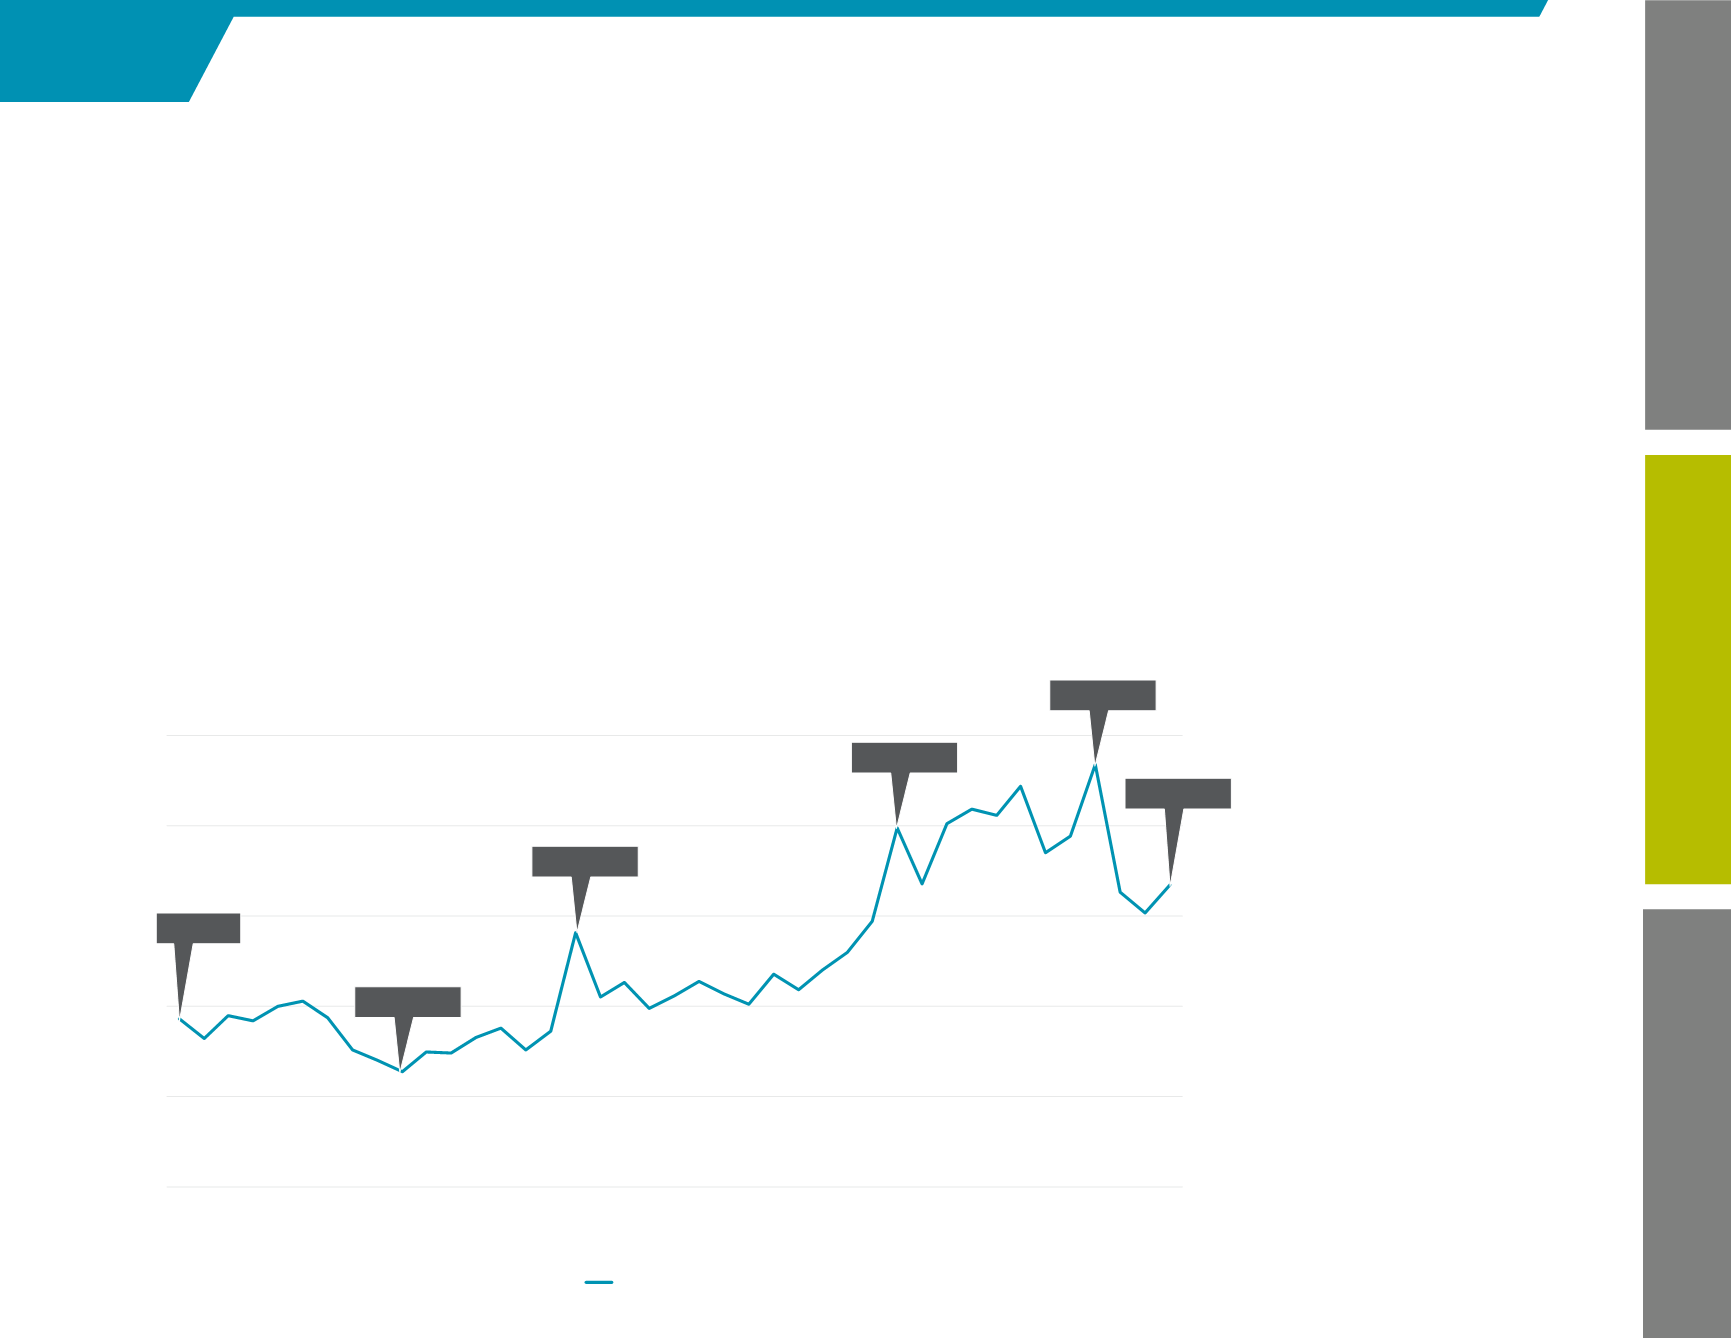
One or two major
VC transactions can
greatly influence the
activity by quarter –
a lack of major deals
in Q4 2016 resulted
in a sharp decline.
Venture Capital Funding
U.S. HISTORICAL VC FUNDING
Source: PitchBook
$0
$5
$10
$15
$20
$25
Q1 2007
Q3 2007
Q1 2008
Q3 2008
Q1 2009
Q3 2009
Q1 2010
Q3 2010
Q1 2011
Q3 2011
Q1 2012
Q3 2012
Q1 2013
Q3 2013
Q1 2014
Q3 2014
Q1 2015
Q3 2015
Q1 2016
Q3 2016
Q1 2017
Deal Value ($B)
$9.3B
$16.7B
$14.1B
$6.4B
$19.9B
$23.4B