


 51 / 60

Financial Information | Cushman & Wakefield | 51
0.0%
10.0%
20.0%
30.0%
40.0%
50.0%
60.0%
70.0%
80.0%
90.0%
100.0%
0
10,000
20,000
30,000
40,000
50,000
FYE 2018 FYE 2019 FYE 2020 FYE 2021
FYE 2022 FYE 2023 FYE 2024
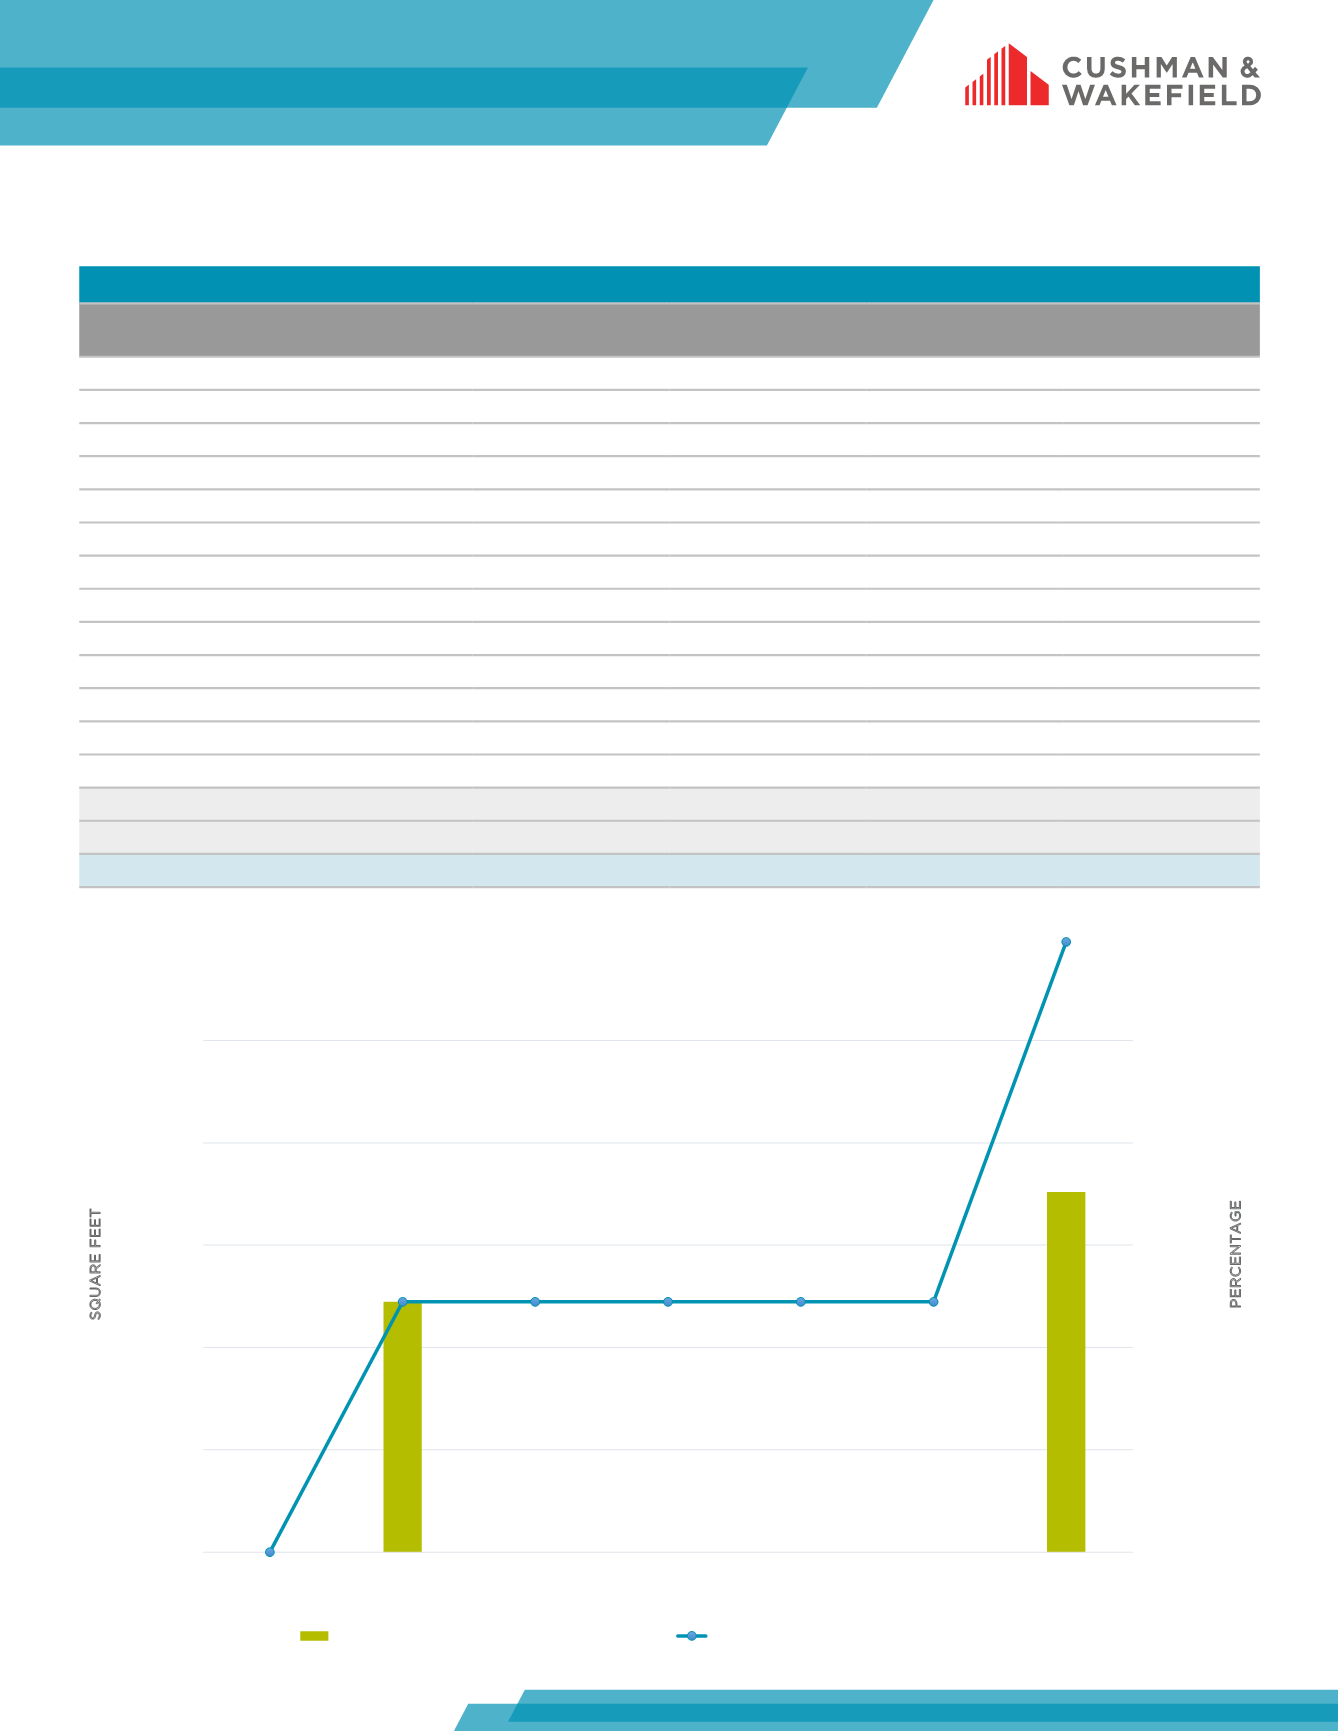
PERCENTAGE
SQUARE FEET
Annual In-Place Lease Expirations
Cumulative In-Place Lease Expiration %
(Weighted Avg. Lease Term Remaining = 4.62 YRS)
IN-PLACE LEASE EXPIRATION
Fiscal Year Ending
October 31
Number of Spaces Expiring Square
Feet
Percentage of Total
Square Feet
Cumulative Expiring
Square Feet
Percentage of Total
Square Feet
FYE 2018
0
0
0.0%
0
0.0%
FYE 2019
2
24,458
41.0%
24,458
41.0%
FYE 2020
0
0
0.0%
24,458
41.0%
FYE 2021
0
0
0.0%
24,458
41.0%
FYE 2022
0
0
0.0%
24,458
41.0%
FYE 2023
0
0
0.0%
24,458
41.0%
FYE 2024
3
35,186
59.0%
59,644
100.0%
FYE 2025
0
0
0.0%
59,644
100.0%
FYE 2026
0
0
0.0%
59,644
100.0%
FYE 2027
0
0
0.0%
59,644
100.0%
FYE 2028
0
0
0.0%
59,644
100.0%
FYE 2029
0
0
0.0%
59,644
100.0%
Beyond
0
0
0.0%
59,644
100.0%
In-Place
5
59,644
100.0%
Vacant
0
0
0.0%
Total
5
59,644
100.0%