


 10 / 26

10 |
Ten-Year Network Development Plan 2017 Annex G: Gas Quality Outlook
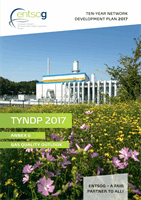
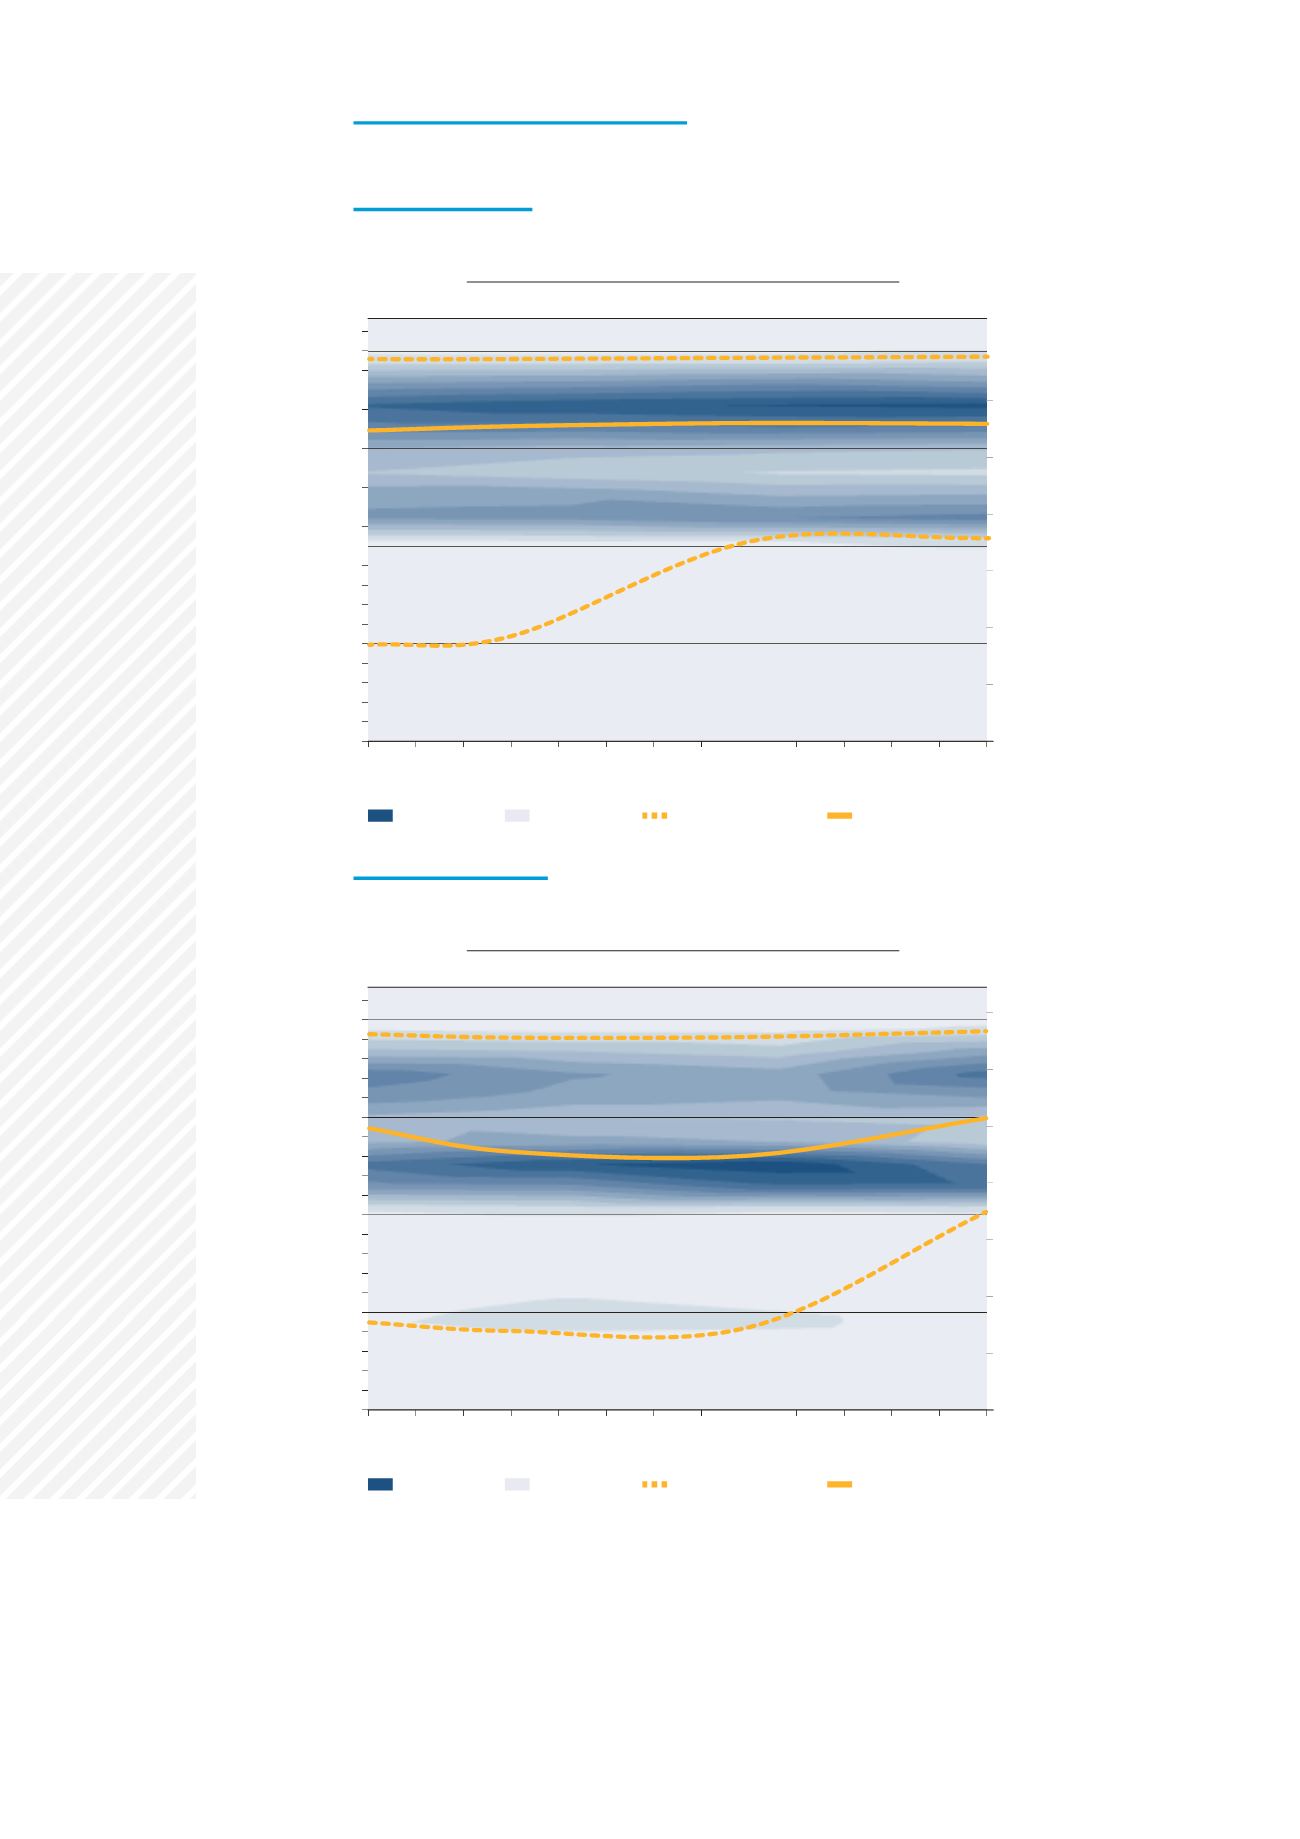
SOUTH REGION: ES, FR, PT
South – RU Min
South – LNG Min
WI ranges in this region will remain stable. A supply mix with minimum supply levels
for LNG (LNG min) may lead to higher influence of indigenous production which
would push downwards the lower limit.
As for many of the following graphs, probability is not uniform across the range but
rather concentrated around certain ranges, in this case corresponding to LNG
towards the top of the range and pipeline gases (NO, DZ and RU) towards the
middle part.
53.10
52.10
51.10
50.10
49.10
48.10
47.10
46.10
13.50
14.50
14.00
15.00
15.50
2017
2019
2018
2021 2022
2024
2020
2023
2025 2026 2027 2028 2029 2030
High probability
Low probability
2.5 and 97.5 percentiles
50 percentile (median)
South – RU Min
Wobbe Index (kWh/m
3
, 25/0)
Wobbe Index (MJ/m
3
, 15/15)
53.10
52.10
51.10
50.10
49.10
48.10
47.10
46.10
13.50
14.50
14.00
15.00
15.50
2017
2019
2018
2021 2022
2024
2020
2023
2025 2026 2027 2028 2029 2030
High probability
Low probability
2.5 and 97.5 percentiles
50 percentile (median)
South – LNG Min
Wobbe Index (kWh/m
3
, 25/0)
Wobbe Index (MJ/m
3
, 15/15)