


 8 / 26


8 |
Ten-Year Network Development Plan 2017 Annex G: Gas Quality Outlook
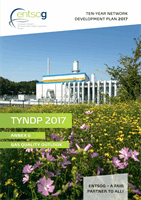
WOBBE INDEX OVERVIEW
2017
2019
2021
2023
2025
2027
2029
South
LNG Min
RU Min
13.50
15.50
53.10
52.10
51.10
50.10
49.10
48.10
47.10
46.10
14.50
14.00
15.00
Wobbe Index (kWh/m
3
, 25/0)
Wobbe Index (MJ/m
3
, 15/15)
2017
2019
2021
2023
2025
2027
2029
South-Nord corridor
LNG Min
RU Min
13.50
15.50
53.10
52.10
51.10
50.10
49.10
48.10
47.10
46.10
14.50
14.00
15.00
Wobbe Index (kWh/m
3
, 25/0)
Wobbe Index (MJ/m
3
, 15/15)
13.50
15.50
53.10
52.10
51.10
50.10
49.10
48.10
47.10
46.10
14.50
14.00
15.00
Wobbe Index (kWh/m
3
, 25/0)
Wobbe Index (MJ/m
3
, 15/15)
2017
2019
2021
2023
2025
2027
2029
UK-IE
LNG Min
RU Min
2017
2019
2021
2023
2025
2027
2029
NW
LNG Min
RU Min
13.50
15.50
53.10
52.10
51.10
50.10
49.10
48.10
47.10
46.10
14.50
14.00
15.00
Wobbe Index (kWh/m
3
, 25/0)
Wobbe Index (MJ/m
3
, 15/15)
2017
2019
2021
2023
2025
2027
2029
BEMIP
LNG Min
RU Min
13.50
15.50
53.10
52.10
51.10
50.10
49.10
48.10
47.10
46.10
14.50
14.00
15.00
Wobbe Index (kWh/m
3
, 25/0)
Wobbe Index (MJ/m
3
, 15/15)
2017
2019
2021
2023
2025
2027
2029
North-South CEE
LNG Min
RU Min
13.50
15.50
53.10
52.10
51.10
50.10
49.10
48.10
47.10
46.10
14.50
14.00
15.00
Wobbe Index (kWh/m
3
, 25/0)
Wobbe Index (MJ/m
3
, 15/15)
2017
2019
2021
2023
2025
2027
2029
Southern corridor
LNG Min
RU Min
13.50
15.50
53.10
52.10
51.10
50.10
49.10
48.10
47.10
46.10
14.50
14.00
15.00
Wobbe Index (kWh/m
3
, 25/0)
Wobbe Index (MJ/m
3
, 15/15)
The WI ranges depicted depend more strongly on
regions than on any other factor and seem to remain
relatively stable for the next ten years.
Trends seem to be in general not very sensitive to
different price configurations. However, within one
region, ranges may actually differ depending on the
influence of different sources: LNG rising the higher
limit and indigenous production the lower.