


 13 / 26


Ten-Year Network Development Plan 2017 Annex G: Gas Quality Outlook |
13
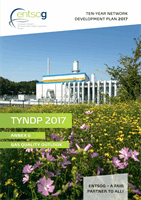
South-North corridor – RU Min
South-North corridor – LNG Min
GCV values show a slight ascending trend under the RU Min supply mix due to the
higher contribution of LNG.
In both supply mixes the decrease of indigenous production will narrow the range.
41.80
40.80
39.80
38.80
37.80
36.80
35.80
34.80
10.20
11.20
10.70
11.70
12.20
2017
2019
2018
2021 2022
2024
2020
2023
2025 2026 2027 2028 2029 2030
High probability
Low probability
2.5 and 97.5 percentiles
50 percentile (median)
South North – RU Min
Gross Calori c Value (kWh/m
3
, 25/0)
Gross Calori c Value (MJ/m
3
, 15/15)
41.80
40.80
39.80
38.80
37.80
36.80
35.80
34.80
10.20
11.20
10.70
11.70
12.20
2017
2019
2018
2021 2022
2024
2020
2023
2025 2026 2027 2028 2029 2030
High probability
Low probability
2.5 and 97.5 percentiles
50 percentile (median)
South North – LNG Min
Gross Calori c Value (kWh/m
3
, 25/0)
Gross Calori c Value (MJ/m
3
, 15/15)