


 14-15 / 84

BALKAN VITAL GRAPHICS
14
BACKGROUND
MINING
WATER
NATURE
15
Fighting may have ended but migration continues. De-
spite increasingly strict EU policies on immigration, the
“western dream” still exerts a powerful force of attrac-
tion on the people of the Balkans. This is particularly
noticeable in Kosovo where half the population is un-
der 20 and unemployment affects 60 per cent of peo-
ple of working age. The brain drain, primarily among
young graduates, is compromising the future of coun-
tries such as Bosnia and Herzegovina, and Albania. In
recent years there has been an increase in the number
of migrants being forcibly repatriated, under readmis-
sion agreements signed by all the west Balkan coun-
tries with the EU.
In the meantime, the rural exodus is continuing all
over the region, particularly in Albania where people
are deserting mountain areas and the population of
Tirana has risen from 200 000 at the end of the com-
munist era to almost a million. The newcomers cram
into the city outskirts lacking any proper infrastructure.
A similar pattern may be seen in Belgrade, Sarajevo
and Skopje.
����������
�����������
�������
���������
������
�
��
��
��
��
��
��
��
��
��
���
��������
��������������������������������������
����������������������������������
�������
�������
��������
���������������� ����������������
ROMANIA
CROATIA
SERBIA
MONTENEGRO
BULGARIA
MACEDONIA
ALBANIA
Kosovo
BOSNIA AND
HERZEGOVINA
Republic of Srpska
Vojvodina
Federation of
Bosnia and
Herzegovina
GREECE
ITALY
Nis
SKOPJE
Bitola
TIRANA
Durrës
Mostar
Shkodër
Elbasan
BELGRADE
Subotica
Novi Sad
Pristina
SARAJEVO
PODGORICA
Banja Luka
Bihac
Brcko
Zrenjanin
Kraljevo
Pec
Ohrid
Fier
Osijek
Thessaloniki
SOFIA
Split
ZAGREB
Sibenik
Zadar
Pécs
Timisoara
Niksic
Sisak
A
D
R
I
A
T
I
C
S
E
A
0
30
60
90
120
Kilometres
Lambert Azimuthal Equal-Area Projection
International
boundary
Inter-entity
boundary line
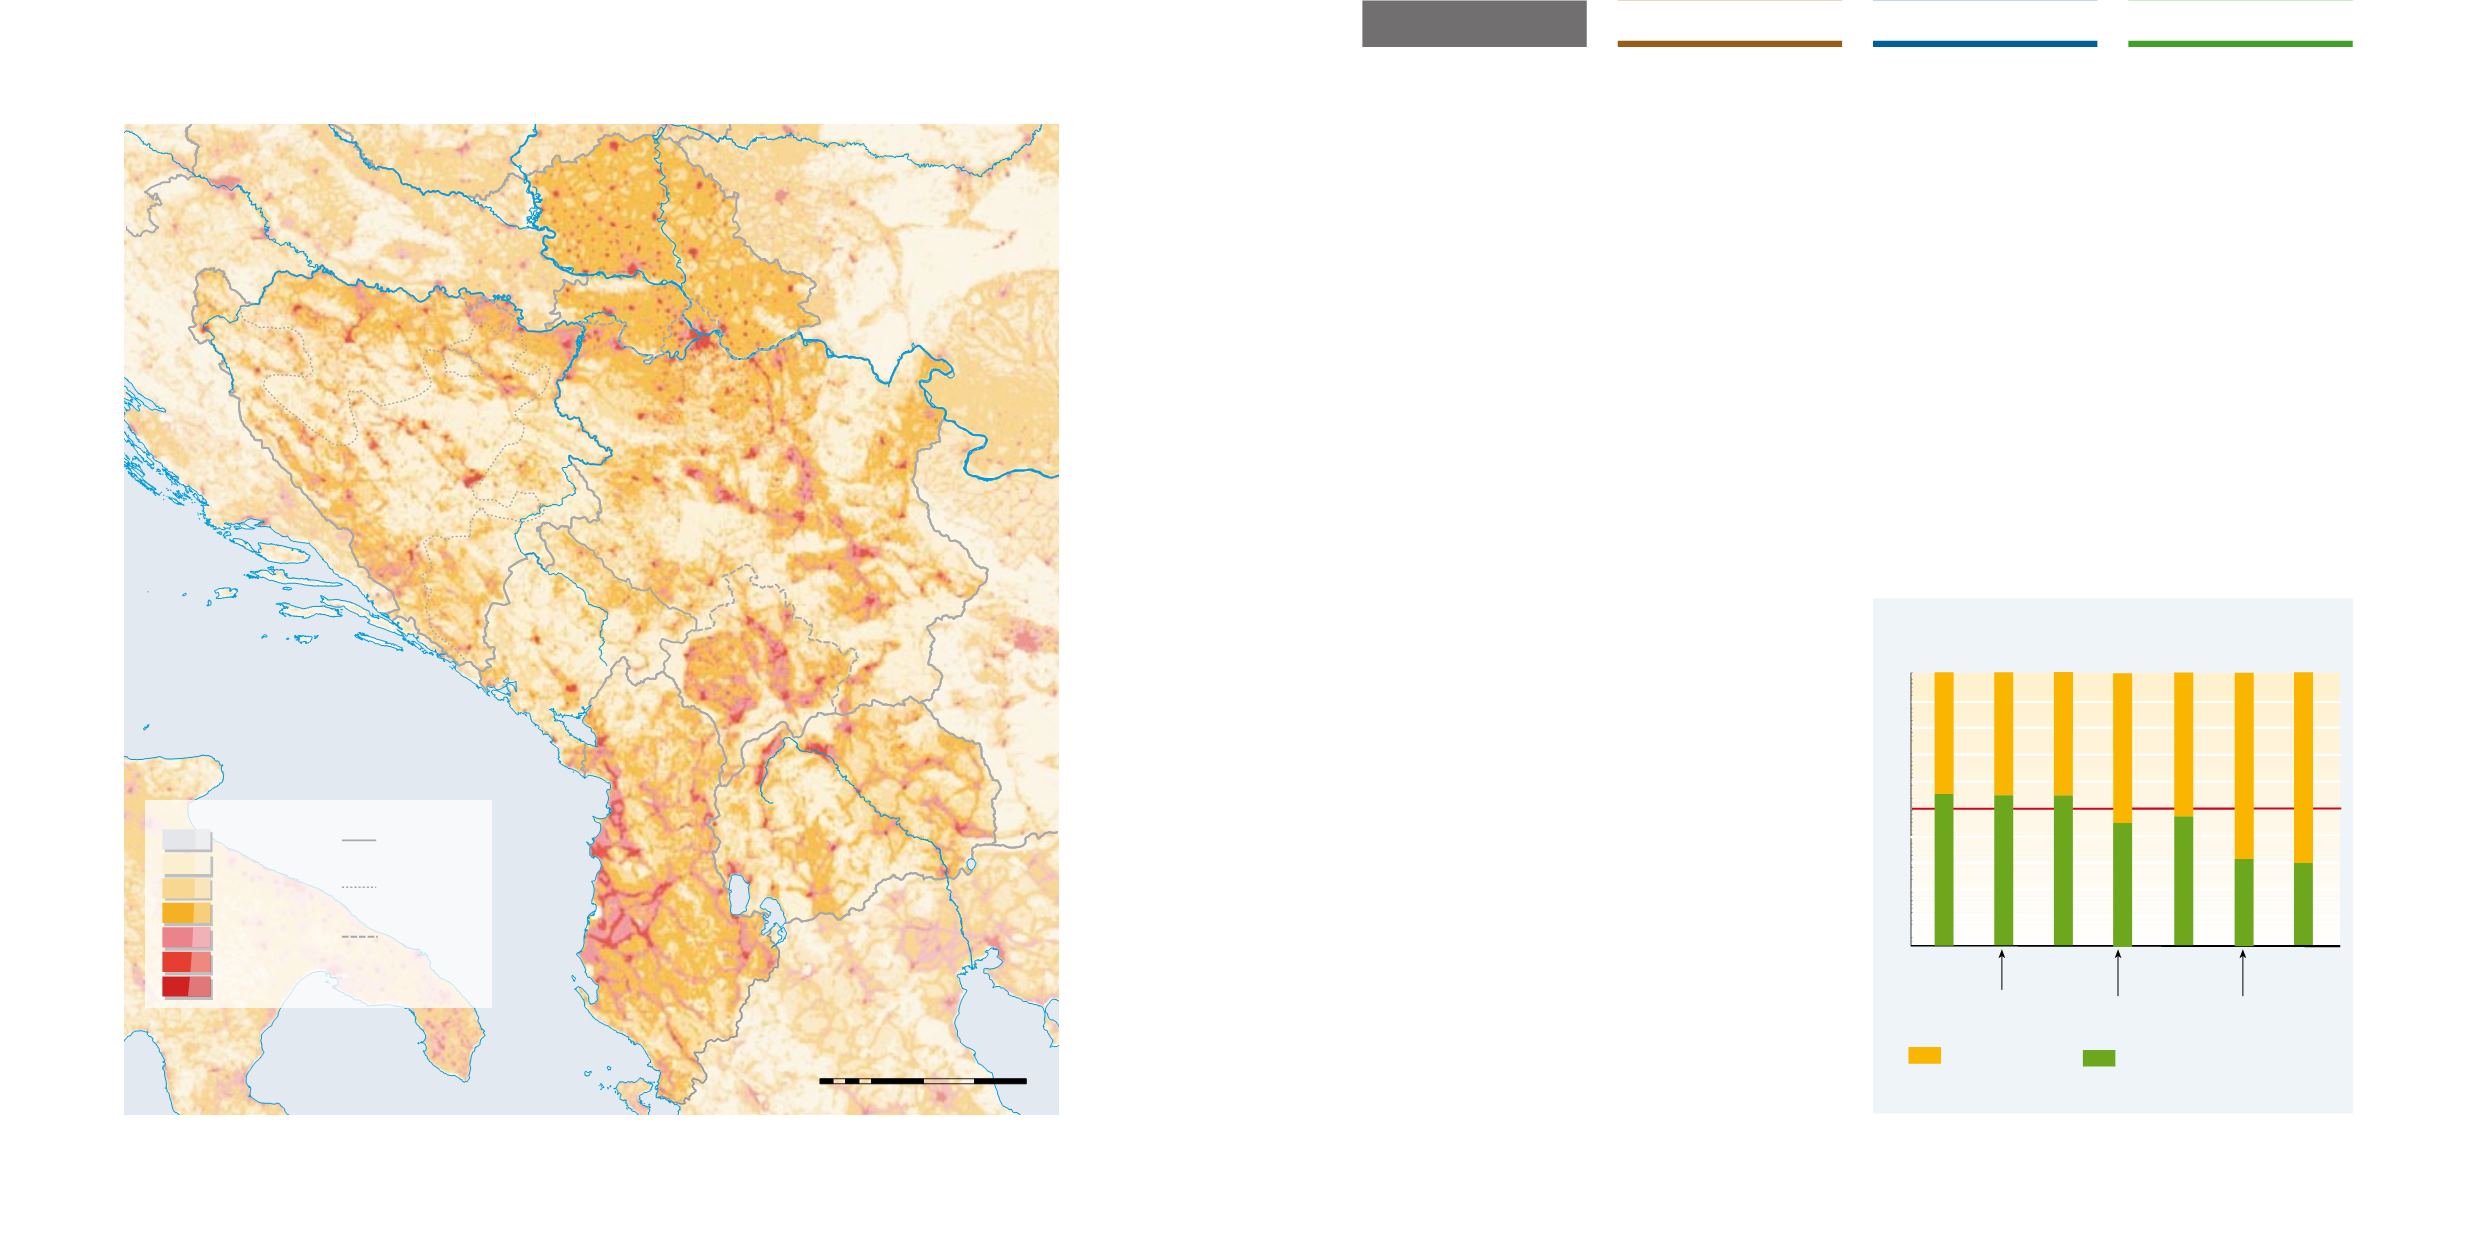
0 - 2
2 - 10
10 - 50
50 - 200
200 - 800
800 - 3 000
no data
Inhabitants per km
2
Autonomous
boundary
The boundaries and names shown and the designations used on this map do not imply
official endorsement or acceptance by the United Nations.
Map by UNEP/DEWA/GRID-Europe.
Sources: ORNL Landscan 2002; ESRI Data & Maps 2003; UN Cartographic Section.
Population density