


 11 / 12

16
Uneven and unequal
For the past three decades, there has been
a steady decline in poverty rates in the
developing world. As highlighted in Figure 5, this
progress is anticipated to continue, not least
in countries such as China and India. Yet the
contrast between rich and poor remains stark.
Despite overall progress on education, three out
of every four illiterate adults are located in just
ten countries (37 percent of them in India)
37
and about half of all out-of-school children
are in sub-Saharan Africa.
38
According to the
World Bank, more than 1.2 billion people do not
have access to electricity, including 550 million
in Africa and 400 million in India.
39
Societies
and individuals are becoming increasingly
unequal. The Gini coefficient – an imperfect
measure of the gap between the richest and
poorest – has risen by more than 10 percent in
OECD countries since 1992. In some emerging
countries such as China, India, Russia and South
Africa, it is widening rapidly.
40
Generational and gender divides
One third of the world’s labour force
began 2012 poor or unemployed; global
unemployment is expected to remain over
200 million until at least 2015. According to
the ILO, over the past five years long-term
unemployment has increased in 60 percent of
advanced and developing countries where there
is available data.
41
Young people are 3–4 times
more likely to be without a job: the global youth
unemployment rate (12.6 percent) is more than
double the unemployment rate of the labour
force as a whole.
42
While there has been solid progress on reducing
extreme poverty (by 2050 it might only
remain a concern in India and sub-Saharan
Africa
43
), social exclusion persists (through
unemployment, poverty or a lack of access
to political, economic, educational or societal
processes).
44
Exclusion hits the old, the young
and women hardest, especially in developing
countries. Gender inequality remains a key
barrier to economic growth and poverty
reduction. Women and girls account for six out
of ten of the world’s poorest and two-thirds
of the world’s illiterate people. According to
the UNDP, women perform 66 percent of
the world’s work, but earn just 10 percent
of the income and own only 1 percent of the
property.
45
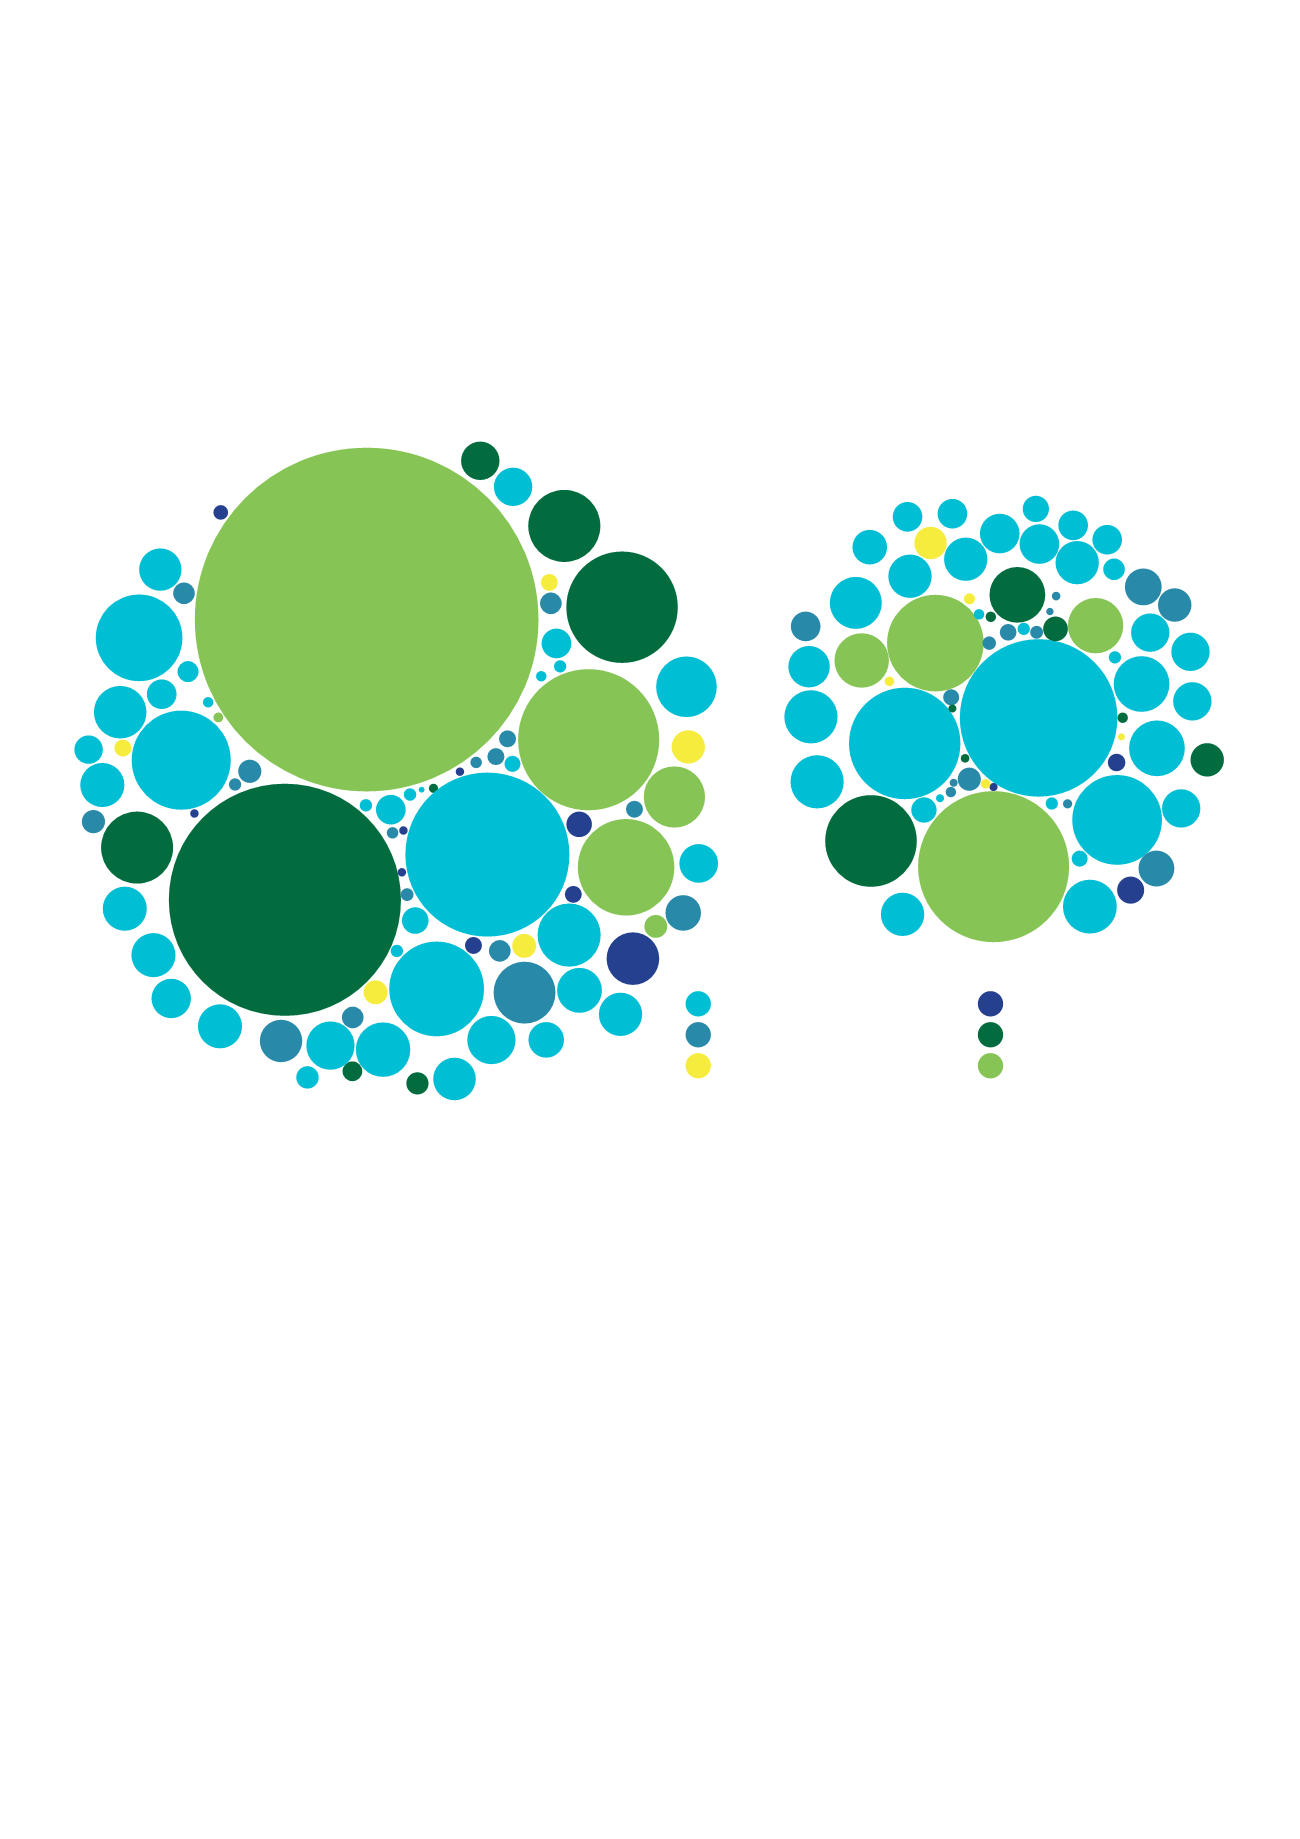
Society
Figure 5: The changing global poverty landscape
Note: Numbers refer to individuals living below the international poverty line of USD $1.25 a day, figures rounded to the nearest million. The 2015 numbers are forecasts and for a number of
countries the scale of improvement is indicative of the number of people clustered around the poverty line used in the figure. Source: Laurence Chandy and Geoffrey Gertz,
Poverty in Numbers: The
Changing State of Global Poverty from 2005-2015
(Washington DC: The Brookings Institution, 2011), p. 8.
India
456
China
208
Bangladesh
76
Pakistan
35
NPL
PHL
Vietnam
Indonesia
47
Ethiopia
DRC
38
Tanzania
34
Nigeria
102
MOZ
ZAF
Niger
UGA
MWI
MDG
Brazil
UZB
Nigeria
96
Tanzania
31
UGA
DRC
48
Niger
Chad
MWI
MOZ
Zambia
Angola
Guinea
BFA
Benin
RWA
CIV
KEN
ZAF
BDI
MLI
Bangladesh
33
India
88
Pakistan
NPL
Indonesia
34
PHL
China
Haiti
MEX
COL
CMR
Sub-Saharan Africa
Latin America and Caribbean
Middle East and North Africa
Europe and Central Asia
East Asia and Pacific
South Asia
2005
2015
(Millions of poor people)
MDG
17