


 143 / 208


PEPaNIC trial
141
7
SUPPLEMENTARY FIGURES
Total
No. in PICU
Late PN
Early PN 723
399
216
139
93
717
348
159
103
63
723
399
216
139
93
717
348
159
103
63
723
399
216
139
93
717
348
159
103
63
Total Energy
(kcal/kg/day)
Enteral
Parenteral
Early PN
Late PN
0
25
50
75
100
0
25
50
75
100
d1
d4
d8
d12
d16
d1
d4
d8
d12
d16
Carbohydrates
(gram/kg/day)
2.5
5
7.5
10
12.5
0
d1
d4
d8
d12
d16
2.5
5
7.5
10
12.5
0
2.5
5
7.5
10
12.5
0
d1
d4
d8
d12
d16
d1
d4
d8
d12
d16
2.5
2.5
Protein
(gram/kg/day)
d1
d4
d8
d12
d16
0
0.5
1
1.5
2
0
0.5
1
1.5
2
2.5
d1
d4
d8
d12
d16
0
0.5
1
1.5
2
d1
d4
d8
d12
d16
Fat
(gram/kg/day)
Day after Inclusion
Day after Inclusion
Day after Inclusion
d1
d4
d8
d12
d16
0
0.5
1
1.5
2
2.5
3
3.5
0
0.5
1
1.5
2
2.5
3
3.5
d1
d4
d8
d12
d16
0
0.5
1
1.5
2
2.5
3
3.5
d1
d4
d8
d12
d16
0
25
50
75
100
d1
d4
d8
d12
d16
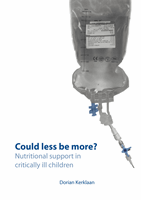
Supplementary Figure 1.
Caloric and macronutrient intake per kg
Daily amount of energy in kcal/kg/day, and the daily amounts of substrates in g/kg/day, for the first 16
days of pediatric intensive care unit (PICU) stay provided by the enteral route, the parenteral route or both
(total). Bars represent the mean and the whiskers represent the standard error of the mean (SEM). The red
bars represent the late parenteral nutrition (PN) group; the blue bars represent the early PN group.