


 145 / 208


PEPaNIC trial
143
7
Days after Inclusion
Cumulative Proportion of Patients Alive
G
0 10 20 30 40 50 60 70 80 90
0.90
0.91
0.92
0.93
0.94
0.95
0.96
0.97
0.98
0.99
1.00
* P = 0.251
$ P = 0.075
A
Cumulative Proportion
Discharged from PICU
0.001
0.2
0.4
0.6
0.7
0.8
0.9
0.92
0.94
0.96
* P < 0.001
$ P < 0.001
0 1 2 3 4 5 6 7 8 10 12 14 16 18 20 22 24 26 28 30
B
Cumulative Proportion
Discharged Live from PICU
* P = 0.008
$ P < 0.001
0.001
0.2
0.4
0.6
0.7
0.8
0.9
0.92
0.94
0.96
0 1 2 3 4 5 6 7 8 10 12 14 16 18 20 22 24 26 28 30
Cumulative Proportion
Discharged from Index Hospital
C
D
Cumulative Proportion
Discharged
Live from Index Hospital
0.5
0.1
0.3
0.4
0.6
0.7
0.75
0.8
0.85
* P = 0.004
$ P = 0.002
0 1 2 3 4 5 6 7 8 10 12 14 16 18 20 22 24 26 28 30
0.5
0.1
0.3
0.4
0.6
0.7
0.75
0.8
0.85
* P = 0.011
$ P = 0.001
0 1 2 3 4 5 6 7 8 10 12 14 16 18 20 22 24 26 28 30
Days after Inclusion
Days after Inclusion
Cumulative Proportion
Discharged from Hospital
(Index and Transferral Hospital)
Cumulative Proportion
Discharged Live from Hospital
(Index and Transferral Hospital)
E
0.3
0.4
0.5
0.6
0.7
0.8
0.1
0 1 2 3 4 5 6 7 8 10 12 14 16 18 20 22 24 26 28
* P = 0.007
$ P = 0.001
30
F
0 1 2 3 4 5 6 7 8 10 12 14 16 18 20 22 24 26 28 30
No. in PICU
LatePN
Early PN
723
216
93
37
717
159
63
23
No. in PICU
LatePN
Early PN
723
216
93
37
717
159
63
23
No. in Index Hospital
LatePN
Early PN
723
448
247
129
717
310
219
107
No. in Index Hospital
LatePN
Early PN
723
448
247
129
717
310
219
107
No. in Hospital (Index or Transferral)
LatePN
Early PN
723
475
278
144
717
449
245
126
No. in Hospital (Index or Transferral)
LatePN
Early PN
723
475
278
144
717
449
245
126
0.3
0.4
0.5
0.6
0.7
0.8
0.1
* P = 0.016
$ P = 0.020
Early PN
Late PN
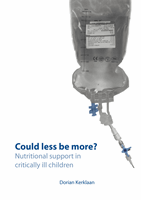
Supplementary Figure 3.
Kaplan-Meier plots for the time to (live) discharge from the PICU and the
hospital and for survival up to 90 days
Panels A to F represent the cumulative proportions of patients discharged from the PICU (A), discharged
live
from the PICU (B), discharged from the hospital [index (C) and total (E)] and discharged
live
from
the hospital [index (D) and total (F)]. For the analyses of the time to discharge, data for all patients were
censored at 90 days, while non-survivors were censored at time of death. For the analyses of the time to
live
discharge, data were censored at 90 days with non-survivors censored at 91 days to account for death
as a competing risk. For sake of clarity, only the first 30 days are shown in panels A-F. Panel G illustrates
survival up to 90 days. The red lines represent the late PN group; the blue lines represent the early PN
group.
*univariable log-rank P-value; $ P-value adjusted in multivariable analysis.