


 3 / 61

Self Storage Performance Quarterly
Source: Cushman &Wakefield, Inc. The
Self Storage Performance Quarterly
, a publication of Cushman & Wakefield, Inc., is intended solely for use by paid subscribers.
Reproduction or distribution in whole or part without written permission is prohibited and subject to legal action. Copyright ® 2016
Cushman & Wakefield | Valuation & Advisory
ii
-5.0%
0.0%
5.0%
10.0%
15.0%
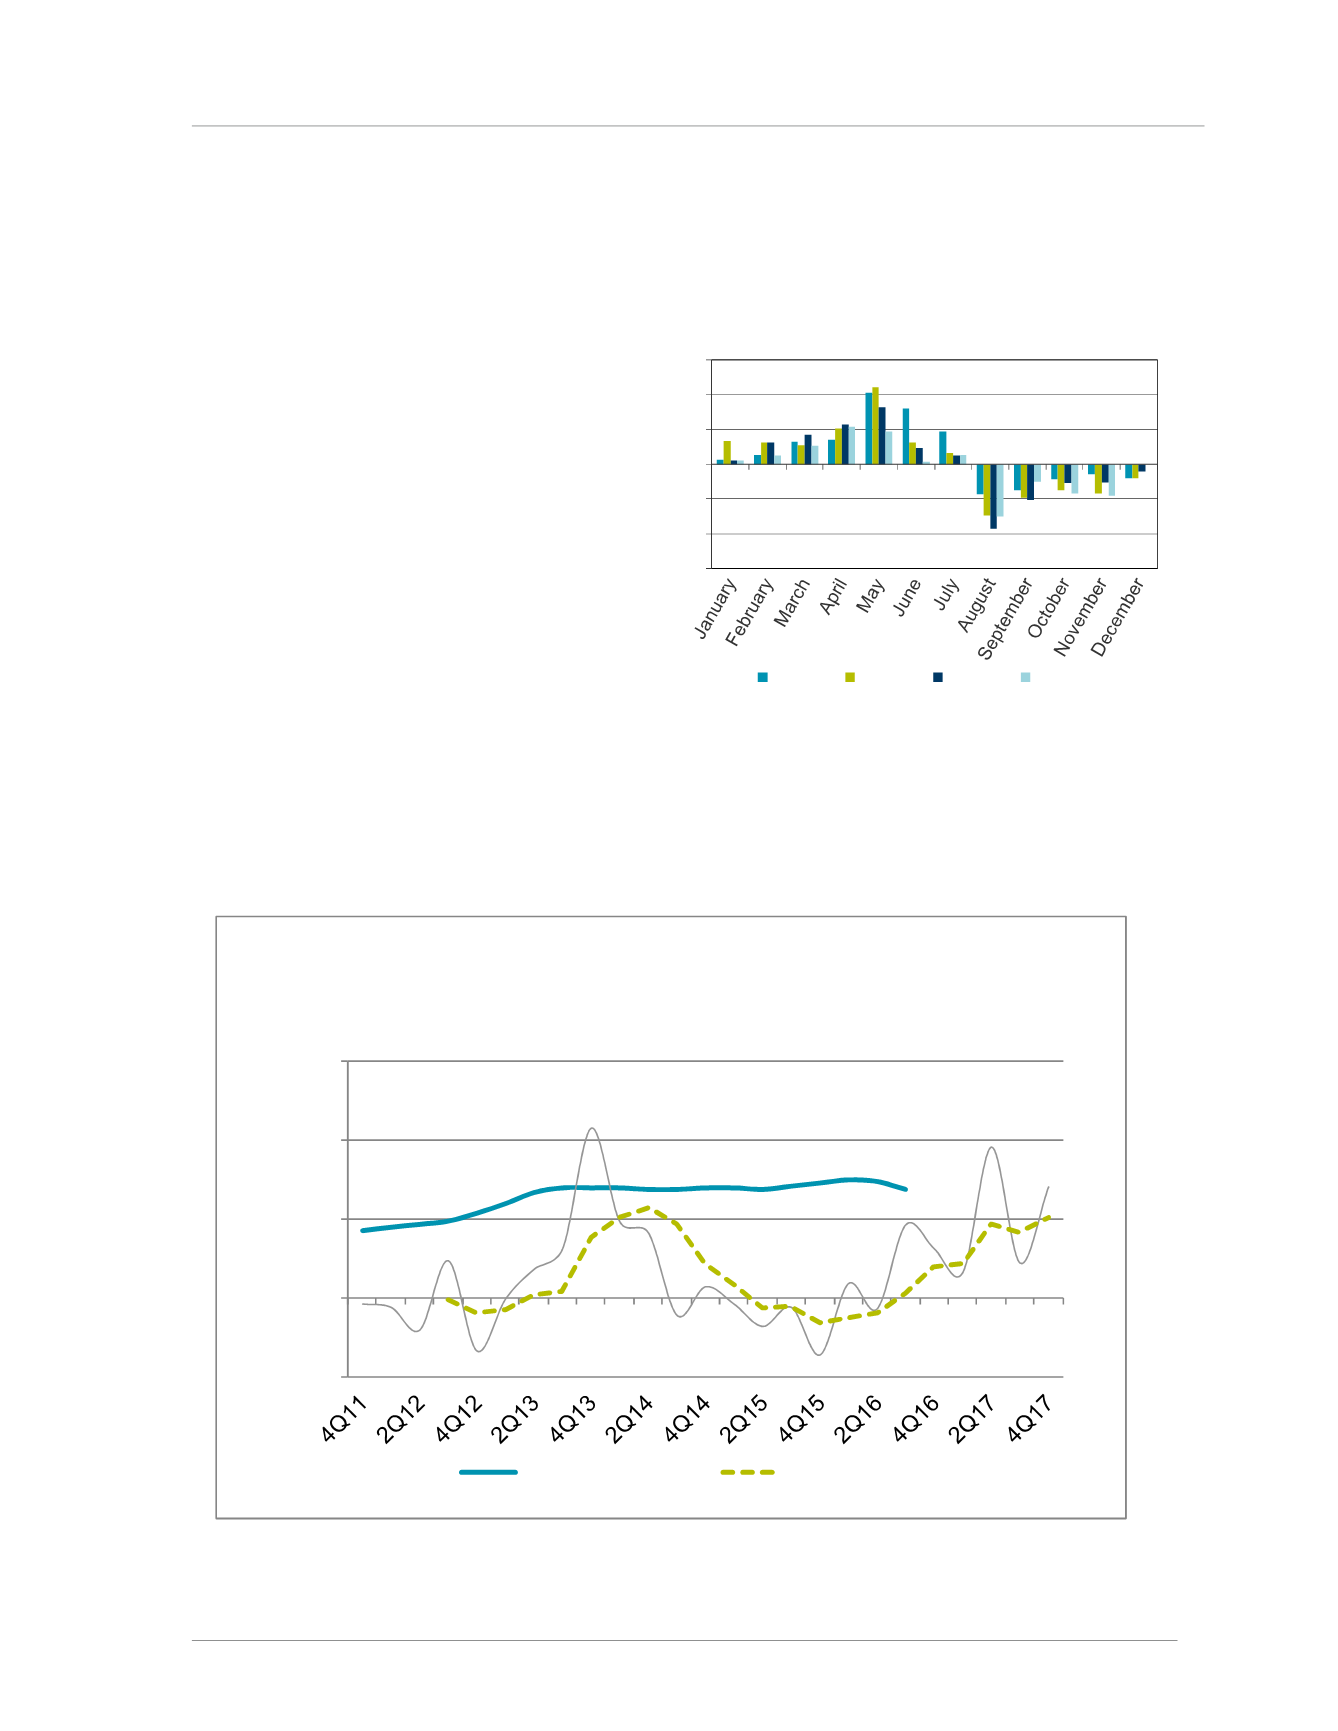
SSDS' Rent per Available Square Foot vs. the Average Four REITs
Rental Income
(Percentage Change - 1Yr Moving Average)
"REITs"
SSDS RPASF
The SSPI Self-Storage Performance Index increased in the 4
th
quarter 2016, and is at 121.4 a positive 6.7%
change from 3
rd
quarter 2016. Moreover, it increased 7.2% compared to 4
th
quarter 2015.
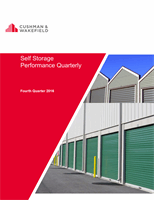
Monthly Unit Absorption
- Net unit
absorption
(move-ins less move-outs)
indicates a slight negative trend. For example,
the total rental activity was up 8.0% in 4
th
Quarter 2016 vs. 4
th
Quarter 2015, and the
monthly unit absorption was slightly negative.
The graph illustrates the average net number
of units rented each month and is based upon
a sample of 450 thousand storage units
nationwide.
Leading Indicator
– Self Storage Data
Service’s Rent per Available Square Foot
(RPASF) is premised upon asking rental rates
and since it takes six to twelve months to be
fully reflected in the facilities performance,
RPASF is considered to be a leading indicator.
To measure the validity of this indicator, SSDS tracks the correlation between RPASF and the average rental
income as reported by the four REITs. There is a fairly high degree of statistical correlation between the two as
can be seen in the graph. The data demonstrates that the pace in rent growth will slow, a function of revenue
enhancement models already showing significant growth the past three years. Rent growth in self storage will
continue to exceed other real estate sectors.
-15
-10
-5
0
5
10
15
Net Units Rented
Net Units Rented
Per Facility Per Month
Nationwide - Average
2013 2014 2015 2016