


 55 / 63


1450
K
oshy
et al
.:
J
ournal of
AOAC I
nternational
V
ol
.
99, N
o
.
6, 2016
Table 6. Retention times of analytes in standards and samples
Substance
Compound
UV detector
PDA detector
Retention time, min Relative retention time Retention time, min Relative retention time
Mixed standard
W-IV
15.516
0.698
16.373
0.705
W-V
19.692
0.885
20.565
0.886
WF-A
20.366
0.916
21.376
0.921
12-D
21.379
0.961
22.368
0.964
W-A
22.242
1.0
23.211
1.0
W-B
25.539
1.148
26.475
1.141
Methanolic extract WS/06Lot10
W-IV
15.376
0.695
16.576
0.713
W-V
19.537
0.883
20.672
0.889
WF-A
20.226
0.914
21.440
0.922
12-D
21.263
0.961
22.400
0.964
W-A
22.128
1.0
23.243
1.0
W-B
25.447
1.149
26.496
1.140
Raw material ERH-046
W-IV
15.547
0.699
16.576
0.713
W-V
19.698
0.886
20.661
0.889
WF-A
20.372
0.916
21.440
0.922
12-D
21.377
0.961
22.389
0.963
W-A
22.239
1.0
23.243
1.0
W-B
25.523
1.148
26.496
1.140
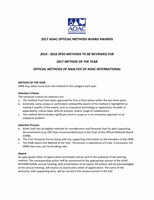
Figure 4. Linearity of response for withanoside IV over the full concentration range by (A) linear regression and (B) residual analysis and
over a truncated concentration range by (C) linear regression and (D) residual analysis.
A
B
C
D
55