


 299 / 369

Sewer—Utility Operations
2016-2020 FINANCIAL PLAN
2014
2015
2015
2016
2017
2018
2019
2020
DIVISION SUMMARY
ACTUAL ACTUAL BUDGET BUDGET
PLAN
PLAN
PLAN
PLAN
Restated
Sewer Utility
2,461
$
(4,431)
$
(782)
$
(646)
$
(1,263)
$
(1,931)
$
(2,632)
$
(3,416)
$
2,461
$
(4,431)
$
(782)
$
(646)
$
(1,263)
$
(1,931)
$
(2,632)
$
(3,416)
$
ACCOUNT SUMMARY
Revenues
Sales and Services
(43,515)
$
(46,128)
$
(44,947)
$
(45,894)
$
(47,939)
$
(50,154)
$
(52,530)
$
(55,129)
$
Grants, Donations and Other
-
(8)
-
-
-
-
-
-
(43,515)
(46,136)
(44,947)
(45,894)
(47,939)
(50,154)
(52,530)
(55,129)
Expenditures
Salaries and Benefits
-
-
-
-
-
-
-
-
Operating Costs
43,541
39,515
44,640
45,878
47,339
48,921
50,632
52,484
Internal Services Used
6,315
9,617
6,288
6,401
6,657
6,923
7,200
7,488
Internal Services Recovered
(4,053)
(7,598)
(6,963)
(7,231)
(7,520)
(7,821)
(8,134)
(8,459)
External Recoveries
(27)
(29)
-
-
-
-
-
-
45,776
41,505
43,965
45,048
46,476
48,023
49,698
51,513
Net Operations Total
2,261
(4,631)
(982)
(846)
(1,463)
(2,131)
(2,832)
(3,616)
Transfers
Transfer From Own Sources
-
-
-
-
-
-
-
-
Transfer To Own Sources
200
200
200
200
200
200
200
200
200
200
200
200
200
200
200
200
2,461
$
(4,431)
$
(782)
$
(646)
$
(1,263)
$
(1,931)
$
(2,632)
$
(3,416)
$
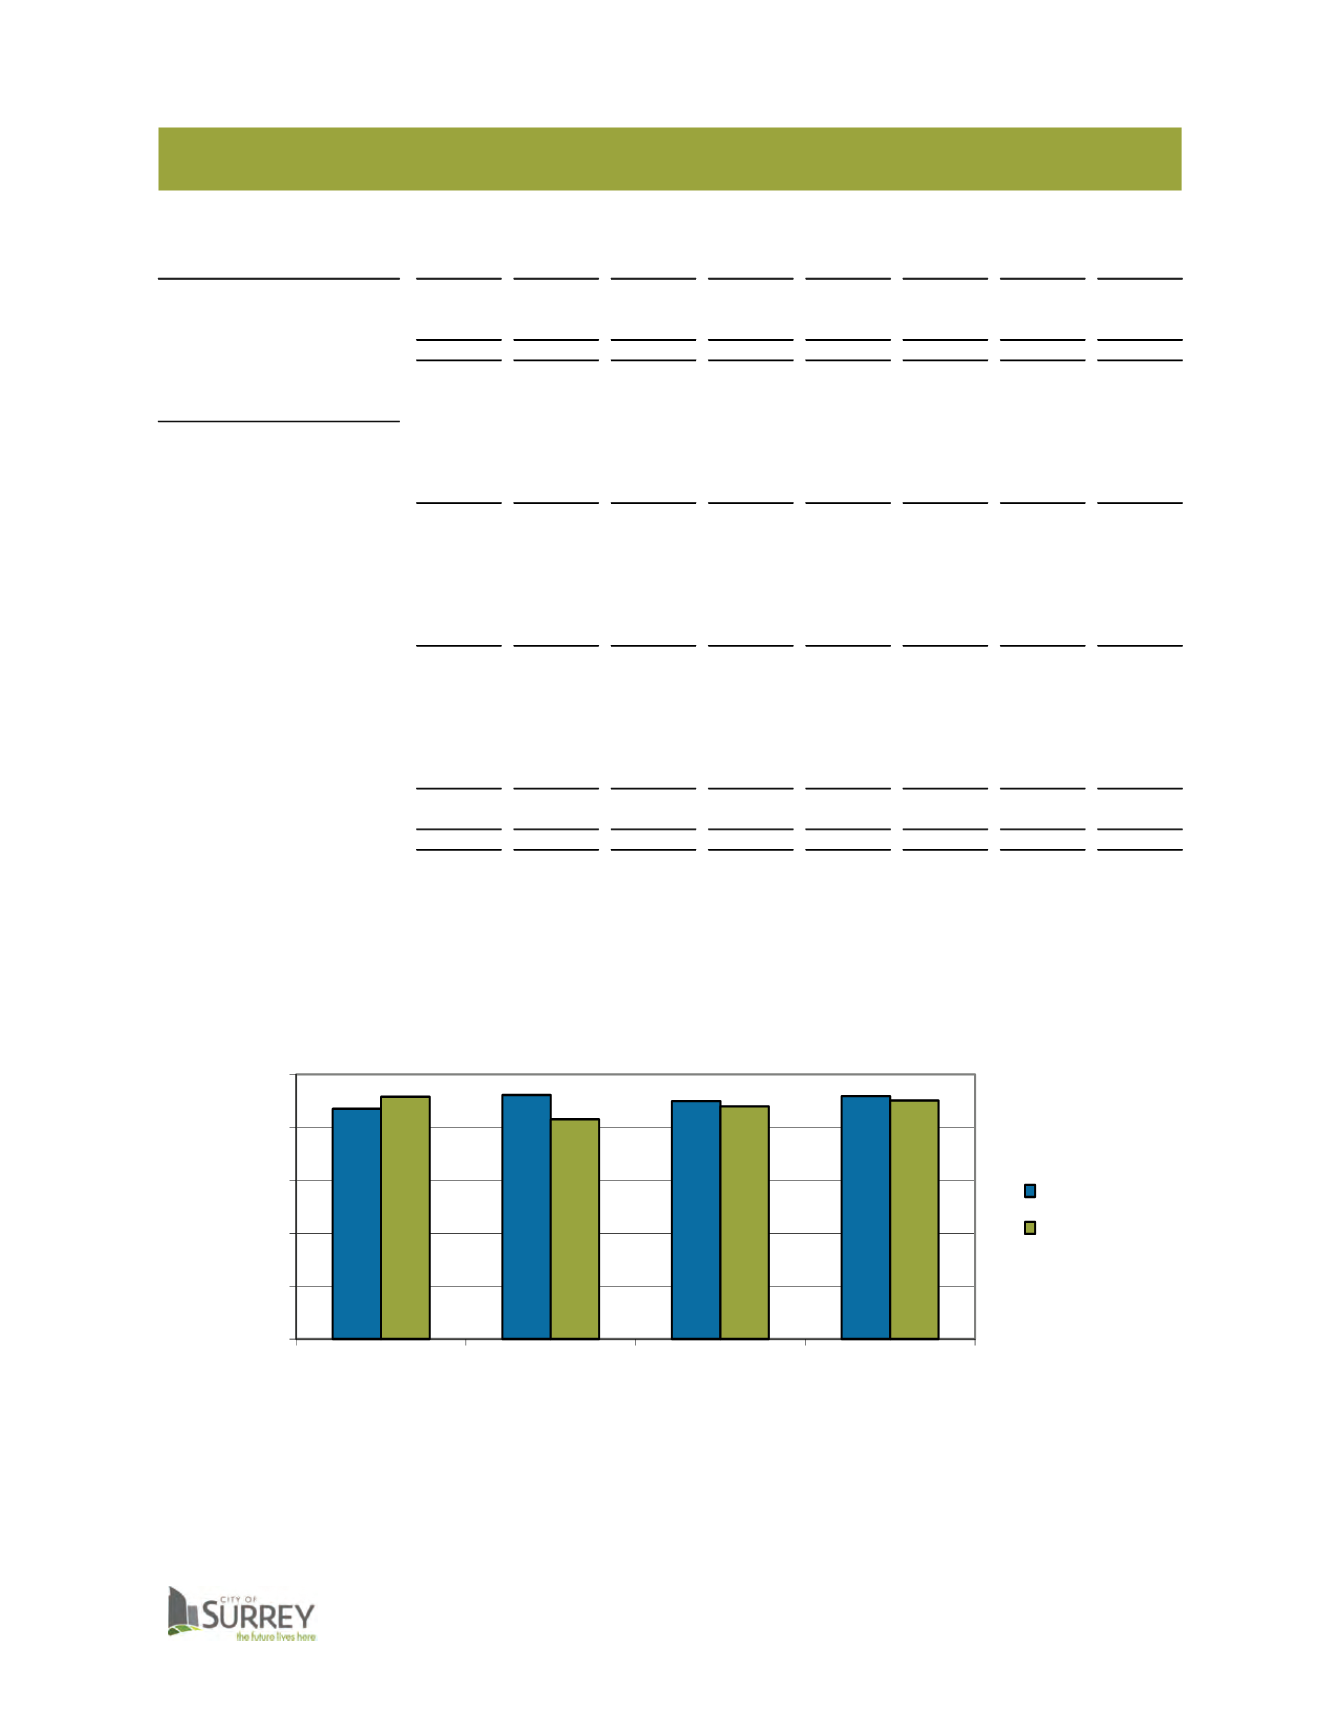
0
10,000
20,000
30,000
40,000
50,000
2014 Actual
2015 Actual
2015 Budget
2016 Budget
Sewer Departmental Operations
($ 000's)
Revenues
Expenses
276