


 63 / 369

FINANCIAL OVERVIEW
MAJOR REVENUE SOURCES
2016-2020 FINANCIAL PLAN
PROPERTY TAXES
Surrey has three major sources of revenue, the most significant of which is property
taxes. In the recent past, Surrey has enacted moderate general tax increases. To fund
increasing costs related to protective services and other City operations, the City will
increase the annual property taxes by approximately $70 along with an $18 increase in
the Roads and Traffic Safety levy for the average single family dwelling for 2016.
Individual property taxes are calculated based on the assessed value of the property.
For 2016, the average residential dwelling was assessed at approximately $720,989 and
assessment growth from new development was estimated at 1.68%. The 2016 tax rates
are available now based on the BC Assessment value for each property.
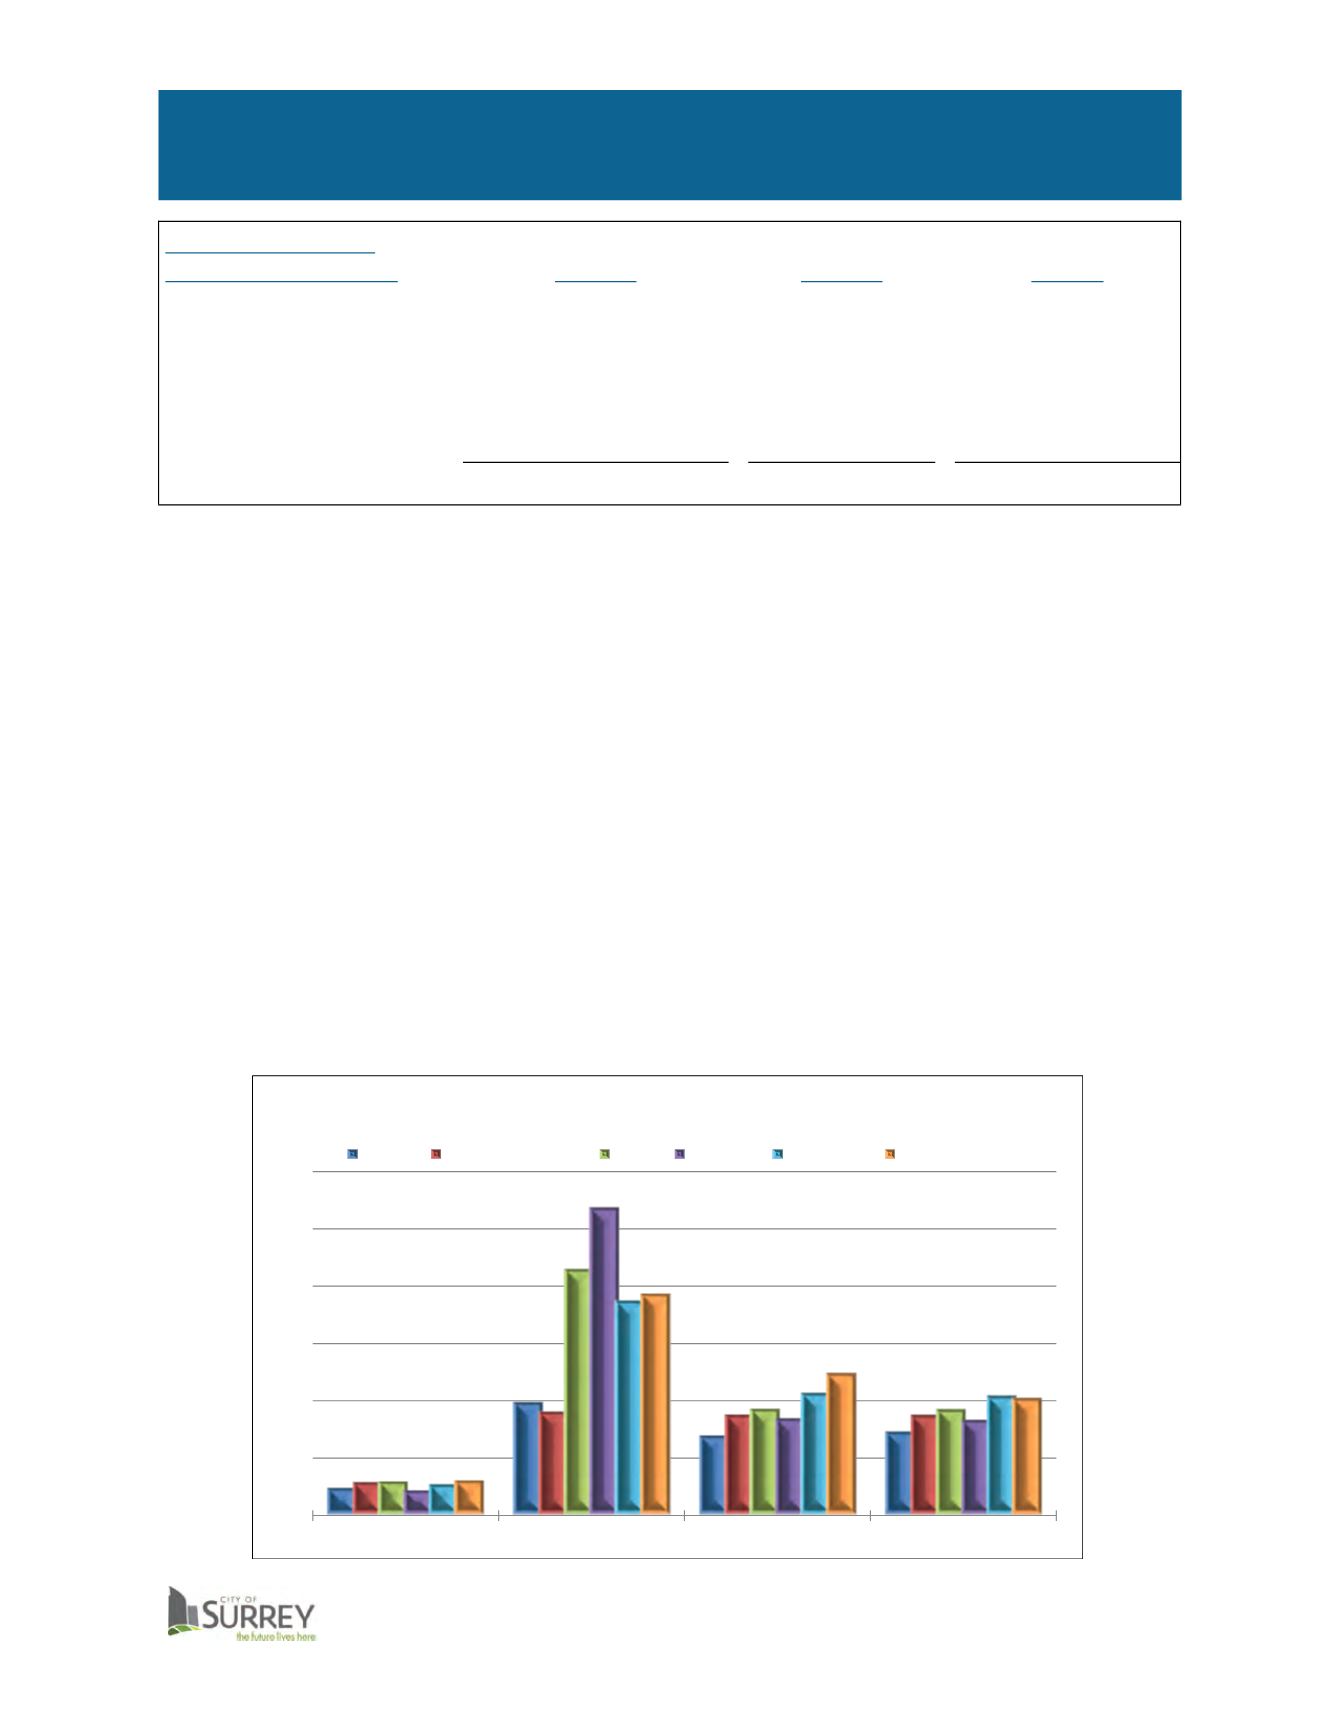
In 2015, Surrey generated approximately 30.20% of its general property tax revenue
from business and industry. Surrey’s 2015 business, light industrial, and major
industrial tax rates compare favourably to neighbouring municipalities. Surrey’s tax
rates are among the lowest in the region, providing a climate conducive to attracting
new commercial and industrial ventures.
General Operating
Revenue ($ millions)
2016
Budget
2015
Budget
2015
Actual
Taxation
$309.6
$294.5
$290.7
Departmental Revenues
$ 79.4
$ 74.4
$ 76.5
Investment Income
$ 13.8
$ 14.1
$ 13.5
Other
$ 36.8
$ 34.5
$ 34.7
Total
$439.6
$417.5
$415.4
$0
$10
$20
$30
$40
$50
$60
Residential
Major Industry
Light Industry
Business
2015 Tax Rates
(per $1,000 assessed value)
Surrey Langley Township Delta Burnaby Coquitlam New Westminster
56