


 18 / 46

TOWN OF MORRISVILLE
16
| Technical Analysis
The demand for retail development will likely be
limited to local residents and employees within two
miles, a fact that further underscores the desirability
of a mixed-use development to create a “virtuous
circle” of demand and supply for goods and services.
The total amount of retail at the McCrimmon station
area site may top out at 100,000 square feet, with
approximately 40% of that space being dedicated
to restaurants and another 17,000 square feet
providing grocery space for specialty retailers such
as Trader Joe’s or Whole Foods markets. Conversely,
the demand for office space – a use that has fueled
much of the recent growth in Morrisville – is
largely going to be driven by offices serving people
well outside the Town, perhaps as much as 80% of
the total 250,000 square feet of office space that is
the upper limit for this use in the station area. An
important consideration in the development of this
much office space is how it visually and functionally
integrates with and supports the “walkable” character
of the station area without dramatically increasing
construction costs borne by private developers.
Smaller offices, which may comprise as much as
43,000 square feet of anticipated office space, may
also develop to service small firms and start-ups.
These smaller firms are an important consideration
when trying to diversify the area’s job opportunities
for local residents and support a resilient
employment base in the Town. Non-residential land
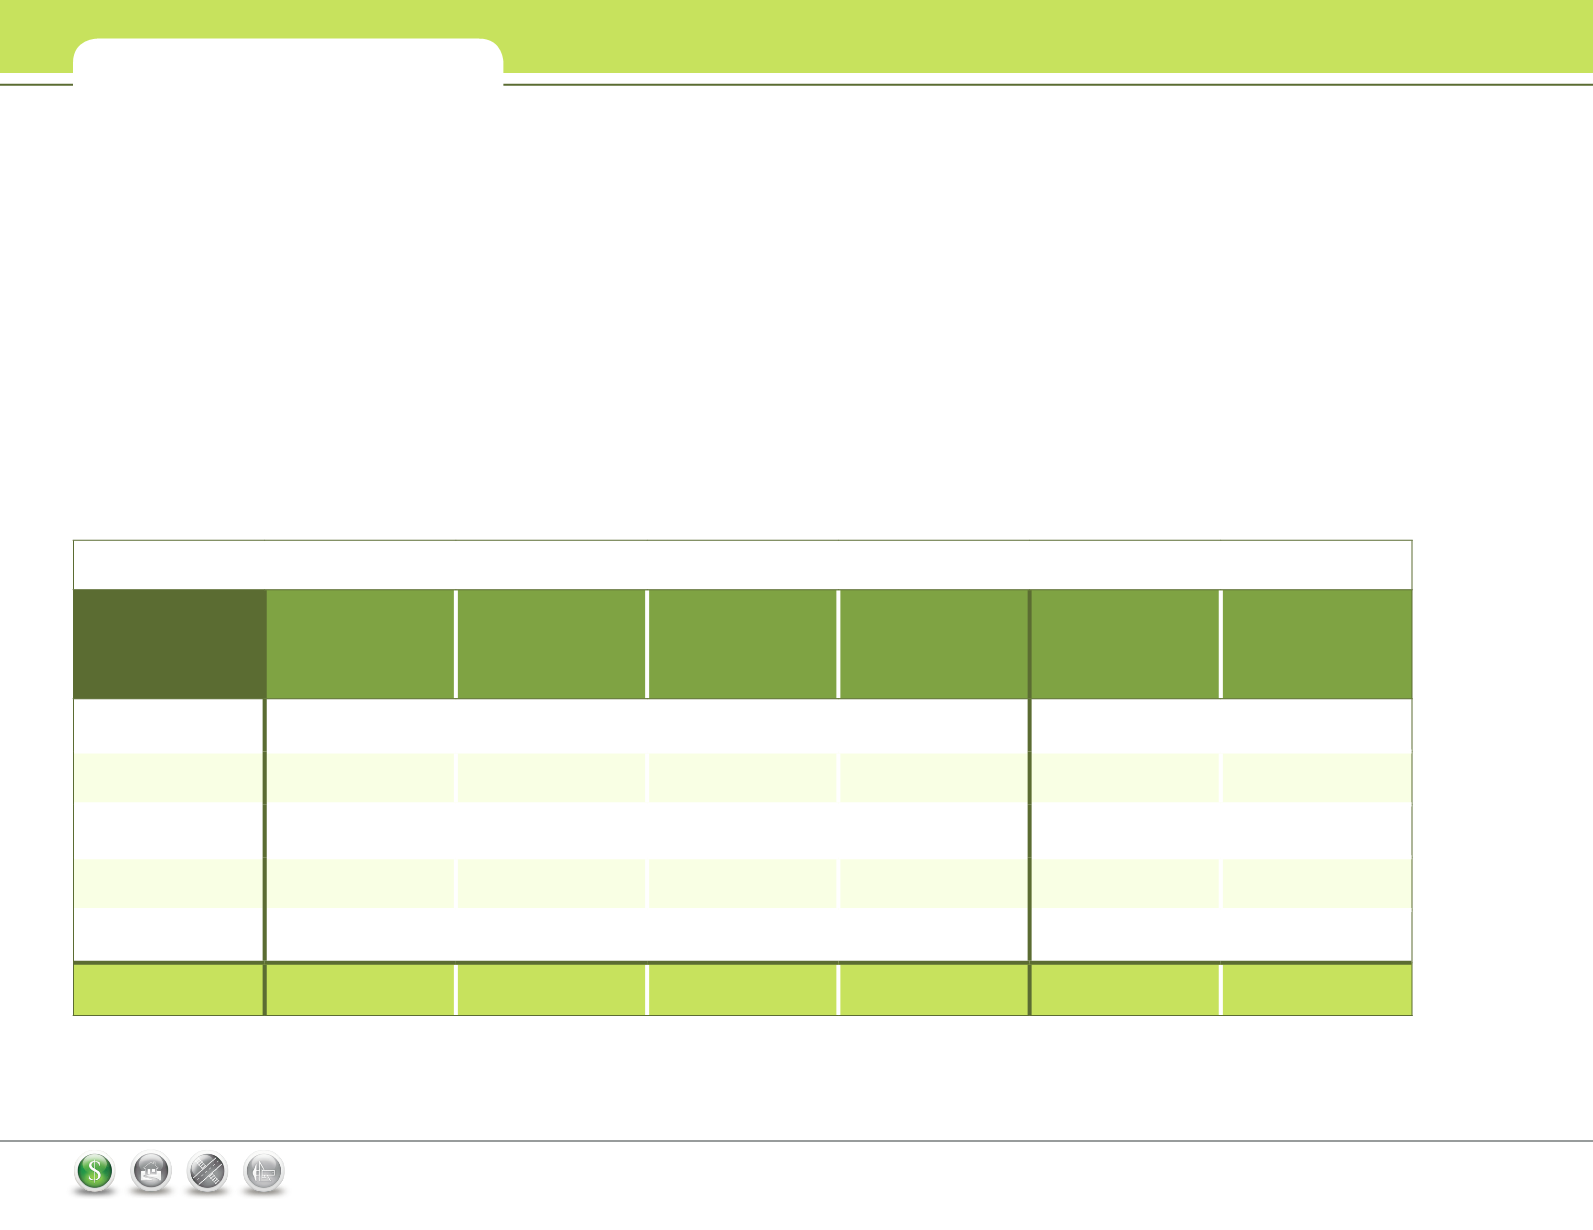
uses are described in the table below.
ESTIMATED COMMERCIAL DEMAND
Non-Residential
Land Use,
by year
New Walkable
Core Office SF
New Regional
Office SF
Retail (square feet)
Limited Service
Hotel (acres)
Total Non-
Residential
(square feet)
Total Acres Devoted
to Non-Residential
Uses
2010-2015
0
28,901
52,700
0
81,602
6.5
2015-2020
10,000
47,232
17,389
4
74,621
9.2
2020-2025
11,000
50,624
16,487
4
78,111
8.8
2025-2030
11,000
42,369
9,115
0
62,485
3.8
2030-2035
11,000
28,572
10,353
0
49,925
3.3
Totals
43,000
197,698
106,044
8
346,744
31.6