


 10 / 68

8
DEMOGRAPHICS
HOSPI TALS
HOSPITALS/SYSTEMS DIGEST 2015
SANOFI / MANAGED CARE DIGEST SERIES
®
/
WHERE INFORMATION BECOMES INTELLIGENCE
.
™
Key Takeaway
That outpatient case counts rose in recent years across almost all the common disease states listed
should perhaps come as little surprise, given the emphasis in health care on reducing admissions
and shifting care to less costly settings. A coincident drop in inpatient admissions count would
also be expected. The challenge for providers will be to sustain these trends, which likely means
increasing coordinated prevention efforts to help patients minimize chronic disease progression.
Data source: IMS Health © 2015
Outpatient Case Counts Climb for 11 Disease States
CHRONIC DISEASE
• From 2012 to 2013, outpatient (OP) case counts
per hospital rose for 11 of 12 profiled disease
states; depression was the exception, with
OP case counts falling, to 750.3 from 761.0.
• During this period, the numbers of inpatient
cases per hospital decreased for nine of these
disease states, but increased for depression (to
350.4), osteoarthritis (176.7) and stroke (180.3).
LOCAL SPOTLIGHT
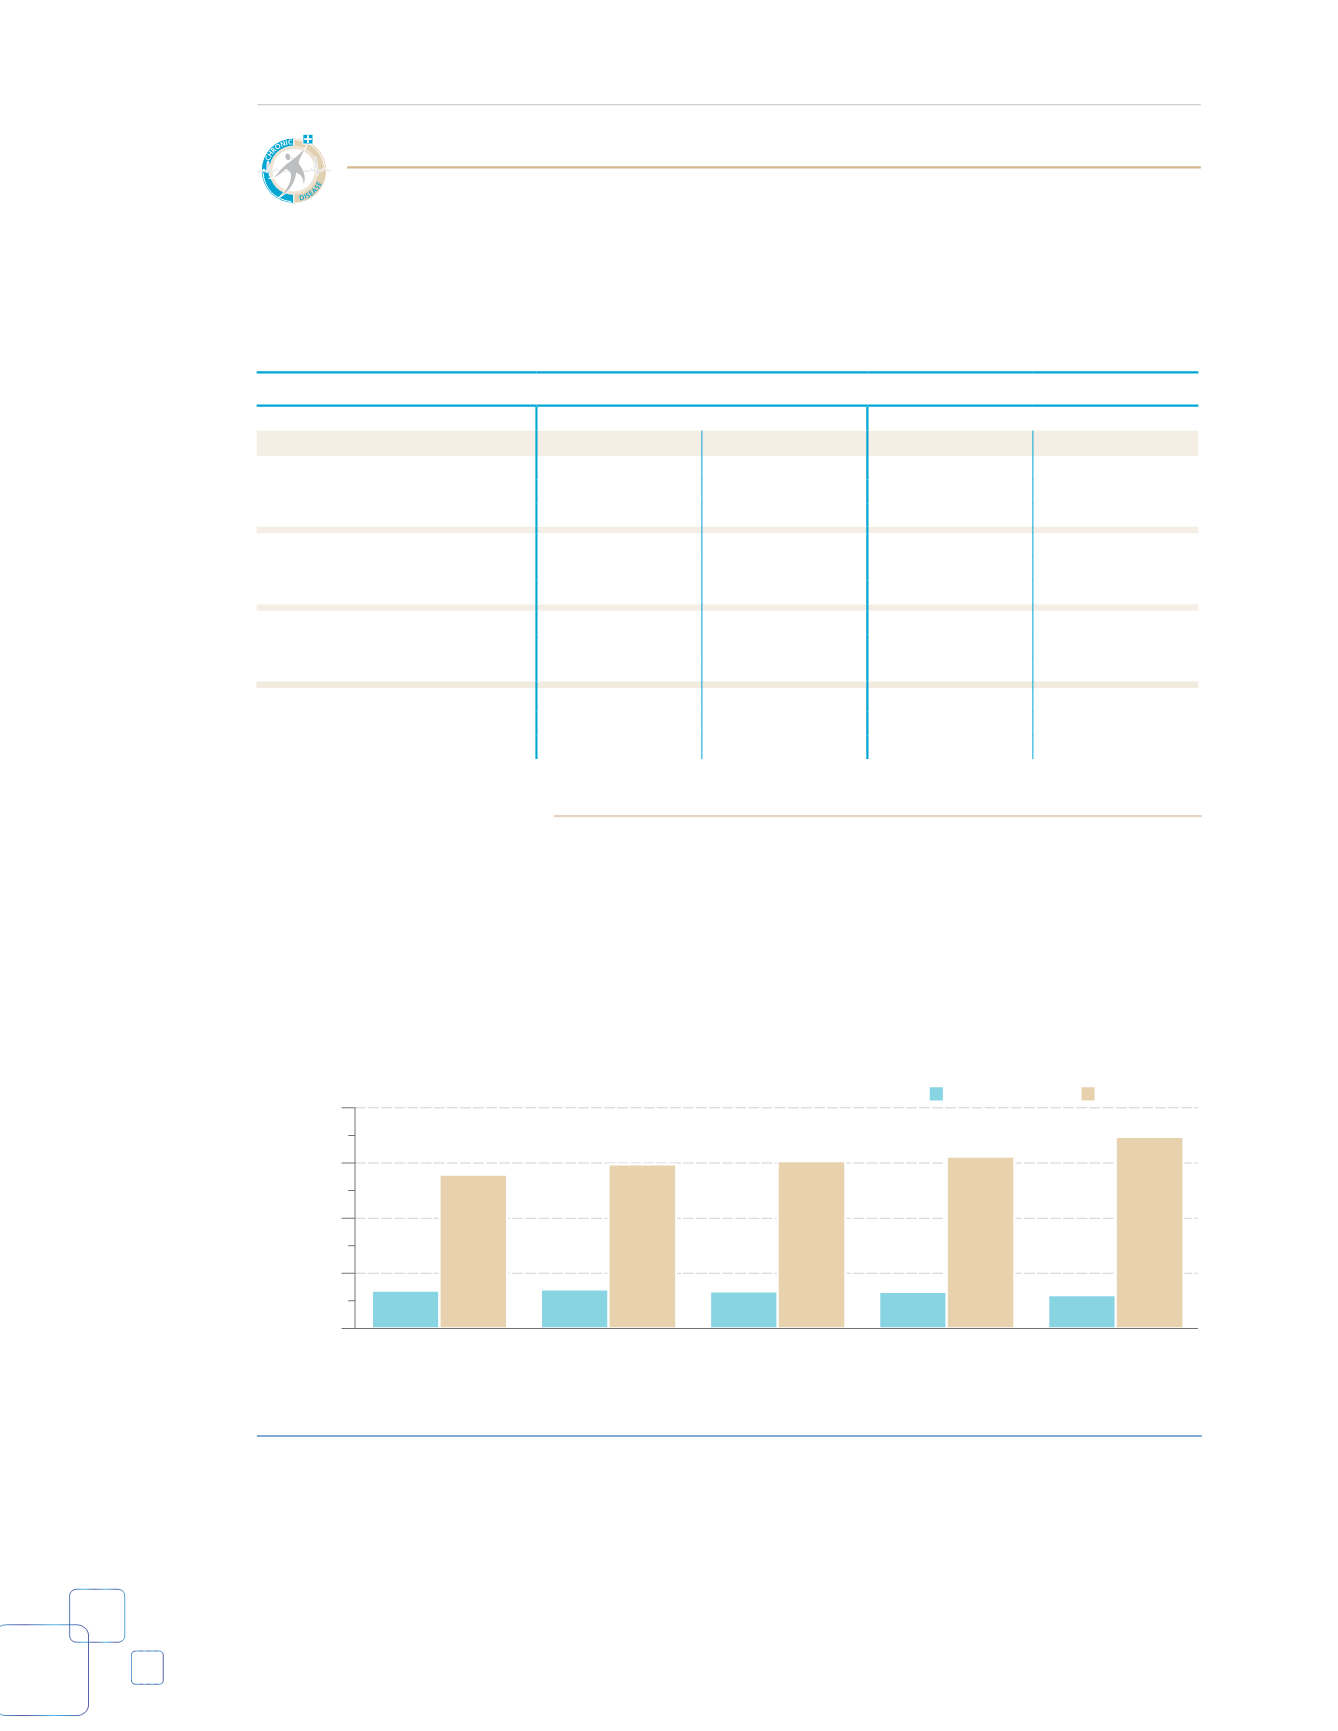
Hypertension Outpatient Case Counts Climb in Florida, as Inpatient Case Counts Drop
• The average number of OP hypertension
cases in Florida increased 19.8%, to 12,422.6 in
2013 from 10,365.5 in 2009. By comparison, the
national average rose, to 8,805.3 from 6,554.2.
• After rising 1.7% from 2009 (4,048.5) to 2010
(4,118.3), average inpatient hypertension
case counts in Florida fell each year
from 2011 (4,019.1) to 2013 (3,811.5).
NUMBERS OF INPATIENT AND OUTPATIENT CASES PER HOSPITAL
1
Inpatient Cases
Outpatient Cases
DISEASE STATE
2012
2013
2012
2013
Acute Coronary Syndromes (ACS)
81.2
74.7
51.5
54.2
Angina
38.4
33.7
146.7
150.6
Asthma
447.8
433.7
2,047.9
2,249.0
Breast Cancer
41.7
39.8
814.5
954.2
Depression
342.3
350.4
761.0
750.3
Diabetes Mellitus
1,249.3
1,245.5
5,748.0
6,435.5
Hypercholesterolemia
245.8
228.0
1,664.3
1,671.3
Hypertension
1,938.6
1,851.9
8,262.1
8,805.3
Osteoarthritis
171.8
176.7
459.6
584.4
Prostate Cancer
41.0
40.2
491.1
511.1
Rheumatoid Arthritis
74.0
73.2
363.3
409.9
Stroke
176.4
180.3
358.0
424.9
NUMBERS OF INPATIENT AND OUTPATIENT HYPERTENSION CASES PER HOSPITAL, FLORIDA, 2009–2013
2009
2010
2011
2012
2013
2,000
5,000
8,000
11,000
14,000
Average Number of Cases
4,048.5
10,365.5
4,118.3
10,920.7
4,019.1
11,096.8
3,991.0
11,339.6
3,811.5
12,422.6
Inpatient
Outpatient
1
Hospital data are based on all short-term, acute-care, nonfederal hospitals and are effective as of end-of-year 2013. Psychiatric, rehabilitation
and children’s hospitals are excluded.