


 17 / 28


Ten Year Network Development Plan 2015 Annex F |
17
€
Quantity
Social Welfare
Marginal
Price
S
D
EU bill
€
Quantity
Social Welfare
Marginal
Price
S
D
EU bill
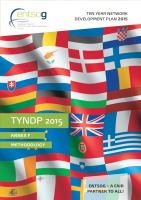
Figure 3.4a:
Social Welfare before the project
€
Quantity
S
D
EU bill
€
Quantity
S
D
EU bill
Figure 3.5a:
Social Welfare with inelastic demand
before the project
Figure 3.4b:
Social Welfare after the project
Figure 3.4b:
Social Welfare with inelastic demand
after the project
Applying this approach to the ESW-CBA modelling approach with an inelastic, the
change in Social Welfare is equivalent to the change in gas, coal and CO ² bill as
shown in the following figures:
3.6 BILL AT EUROPEAN AGGREGATED LEVEL
The gas, coal and CO
2
bill at European level is the main component of the objective
function used to define flow patterns.
For the purpose of mitigating demand curtailment in the maximum possible extent
a fictive weight of disruption higher than any commodity cost has been introduced.
3.7 GAS PRICE INDEX (PROXY FOR THE BILL AT MEMBER
STATE LEVEL)
While implementing the ESW-CBA in TYNDP 2015, ENTSOG noticed that the reac-
tion of the country bill under different price configurations was impacted by many
parameters reducing its interpretability (e. g. size of the gas demand, share of coal
in the power generation mix,…).
Therefore the bill calculation was replaced by the Gas Price Index (GPI) calculated
at Zone level per unit of gas demand.
This process requires the definition of the supply and demand curves of each Zone.
The demand curve is an input of the methodology through the definition of the gas