


 20 / 28


20 |
Ten Year Network Development Plan 2015 Annex F
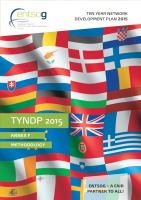
Table 4.1:
List of indicators
4 Indicators
A set of indicators has been defined in order to cover all
specific criteria of the Regulation and to ensure compa-
rability of project assessments.
According to the way the indicators are calculated, two types can be distinguished:
\\
Capacity-based indicators which reflect the direct impact of infrastructures
on a given country as their formulas are limited to capacity and demand of a
country
\\
Modelling-based indicators which reflect in addition the indirect cross-border
impact of infrastructure as their formulas also consider the availability and
nature of flows resulting from the modelling of the European gas system.
The next table defines the list of indicators to be calculated per zone or country as
part of the TYNDP for each Infrastructure (Low, High and PCI), Global Context and
Gas Demand Scenarios on the year 2015, 2020, 2025, 2030 and 2035:
LIST OF INDICATORS
INDICATOR
CLIMATIC CASE
WITHOUT
SUPPLY STRESS
WITH
SUPPLY STRESS
CAPACITY-BASED
N-1
1-DC
N/A
N/A
Import Route Div.
N/A
N/A
N/A
MODELLED-BASED
Remaining Flex.
1-DC & 14-UR
×
×
Disrupted Demand
1-DC & 14-UR
×
×
Cooperative Supply Source Dependence
Whole year*
×
Uncooperative Supply Source Dependence
Whole year*
×
Supply Source Price Diversification
Whole year*
×
Supply Source Price Dependence
Whole year*
×
Price Convergence
Whole year
×
* as the temporal optimization of the succession of one Average Summer Day, one Average Winter Day,
1-day Design Case and 14-day Uniform Risk