


 7 / 28

Ten Year Network Development Plan 2015 Annex F |
7
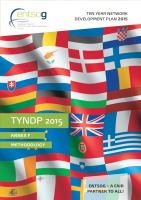
Table 2.2:
Combination of Gas Demand, Global Context and ENTSO-E Visions
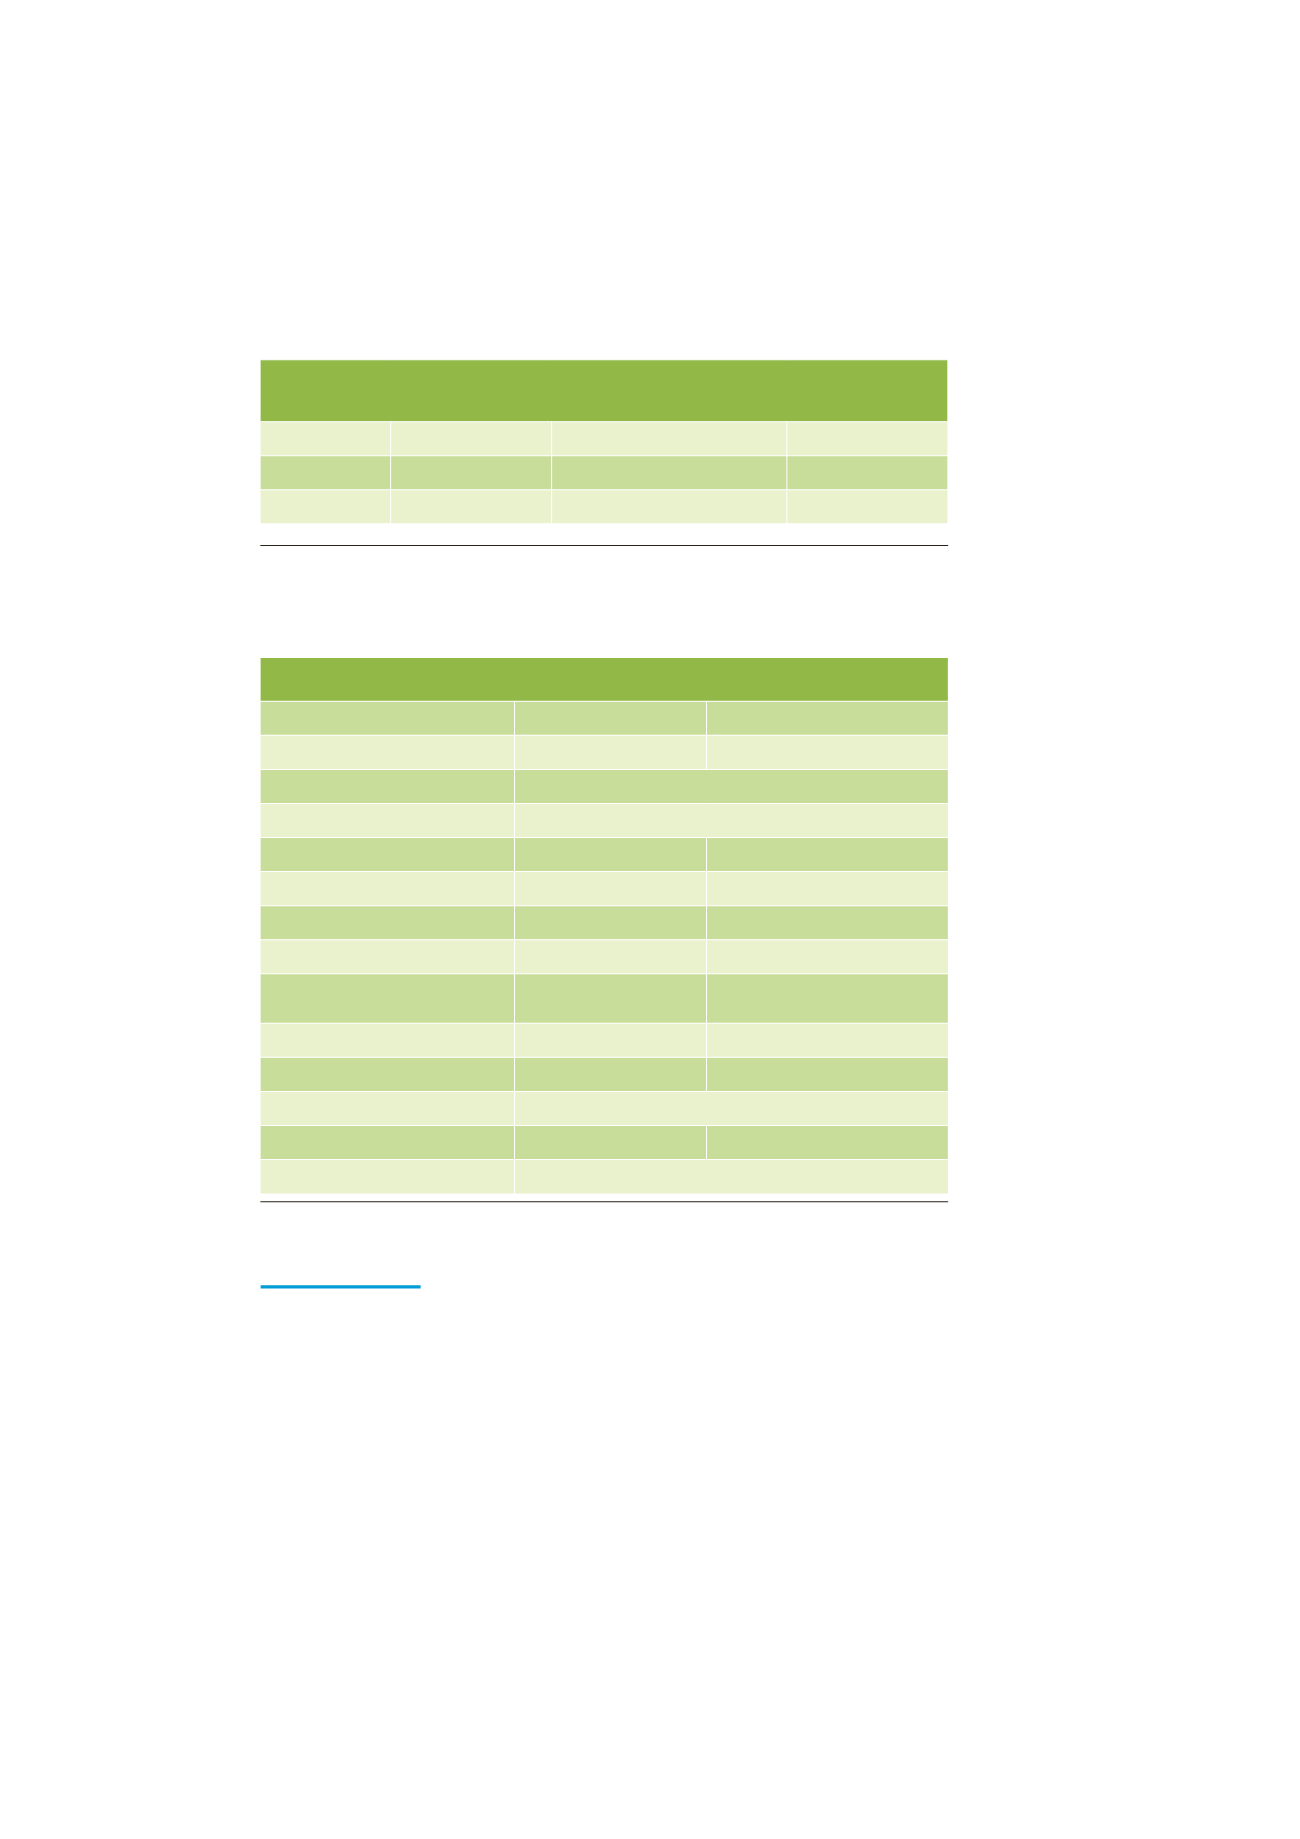
Table 2.3:
Main features of ENTSO-E Visions
\\
The thermal gap (part of electricity demand to be covered by gas- and coal
power generation)
\\
The power generation capacities from gas and coal
\\
The ranges of use and the average efficiencies of the above capacities.
In order to strike the right balance between the number of cases and the robustness
of the assessment, the Table 2 defines two combinations of Gas Demand scenario,
Global Context and ENTSO-E Visions are considered in the ESW-CBA:
COMBINATION OF GAS DEMAND, GLOBAL CONTEXT
AND ENTSO-E VISIONS
COMBINATION
GLOBAL CONTEXT
GAS DEMAND
ENTSO-E VISION
1
Green
A
Green transition
2
Grey
B
Slow progress
The main features of selected ENTSO-E visions are defined in following table:
MAIN FEATURES OF ENTSO-E VISIONS
VISION 1 (SLOW PROGRESS)
VISION 3 (GREEN TRANSITION)
ECONOMIC AND FINANCIAL CONDITIONS
Poor
Favourable
ENERGY POLICIES AND R&D PLANS
National focus
NUCLEAR DECISION
National decision
CO ² PRICES
Low
High
PRIMARY ENERGY PRICES
High
Low
ELECTRICITY DEMAND
Low
High
DEMAND-RESPONSE
As today
Potential partially used
ELECTRICITY PLUG-IN VEHICLES
No commercial breakthrough
Commercial breakthrough with
flexible charging
HEAT-PUMPS
Not even spread across Europe
Not even spread across Europe
LEVEL OF BACK-UP GENERATION
Low
High
CCS
Not commercially implemented
STORAGE
As planned today
Decentralised and in limited amount
SMART GRID SOLUTIONS
Partially implemented
2.4.2
Climatic cases
In order to capture the seasonality of the gas market different levels of gas demand
and thermal gaps are considered along the year. These climatic cases and the asso-
ciated levels of demand are defined as following:
\\
Average Summer day:
Total demand of an average summer divided by 183 as
a proxy for the season
\\
Average Winter day:
Total demand of an average winter divided by 182 as a
proxy for the season
\\
14-day Uniform Risk (14-UR):
aggregation of the level of demand reached on
14 consecutive days once every twenty years in each country to capture the
influence of a long cold spell on supply and especially storages
\\
1-day Design Case (1-DC):
aggregation of the level of demand used for the
design of the network in each country to capture maximum transported energy
and ensure consistency with national regulatory frameworks.