


 6 / 70

3.0%
4.0%
5.0%
6.0%
7.0%
8.0%
9.0%
Millions of Dollars
Retail Growth in the Age
of eCommerce
The continued consumer focus on value,
especially since the recession, has created
significant challenges for bricks-and-mortar
retailers and landlords alike. But it is the
acceleration of eCommerce around the
globe that has been the big disruptor. The
introduction of the tablet in 2010 marked
a turning point. Beginning that year, annual
eCommerce sales growth nearly doubled,
from a consistent range of 7.0% to 8.0% to
15.0% or greater each year after that. Com-
pare that growth rate to overall U.S. retail
sales growth which since 2010 has consis-
tently been in the 2.0% to 3.0% range.
But the rise and success of eCommerce
hasn’t impacted all retail categories evenly.
The story becomes clearer when you
explore eCommerce sales figures as they
apply to a much narrower portion of the
retail world: GAFO. GAFO—the acronym for
general merchandise, apparel and
accessories, furniture and other sales—is
a combination of individual retail categories
that the Commerce Department tracks that
reflect most U.S. mall retail tenants. GAFO
includes the following categories:
• General Merchandise
• Clothing and Clothing Accessories
• Furniture and Home Furnishings
• Electronics and Appliances
• Sporting Goods, Hobbies, Books and
Music
• Office Supplies, Stationery and Gifts
As of August 2016, eCommerce accounted
for 28.2% of all retail sales for these catego-
ries (GAFO). The steady drumbeat of bad
news in 2016 has been dominated by
retailer closures and bankruptcies in these
categories, particularly for apparel and
department stores. Gains from eCommerce
FOOD HALLS OF AMERICA
Source: U.S. Census Bureau
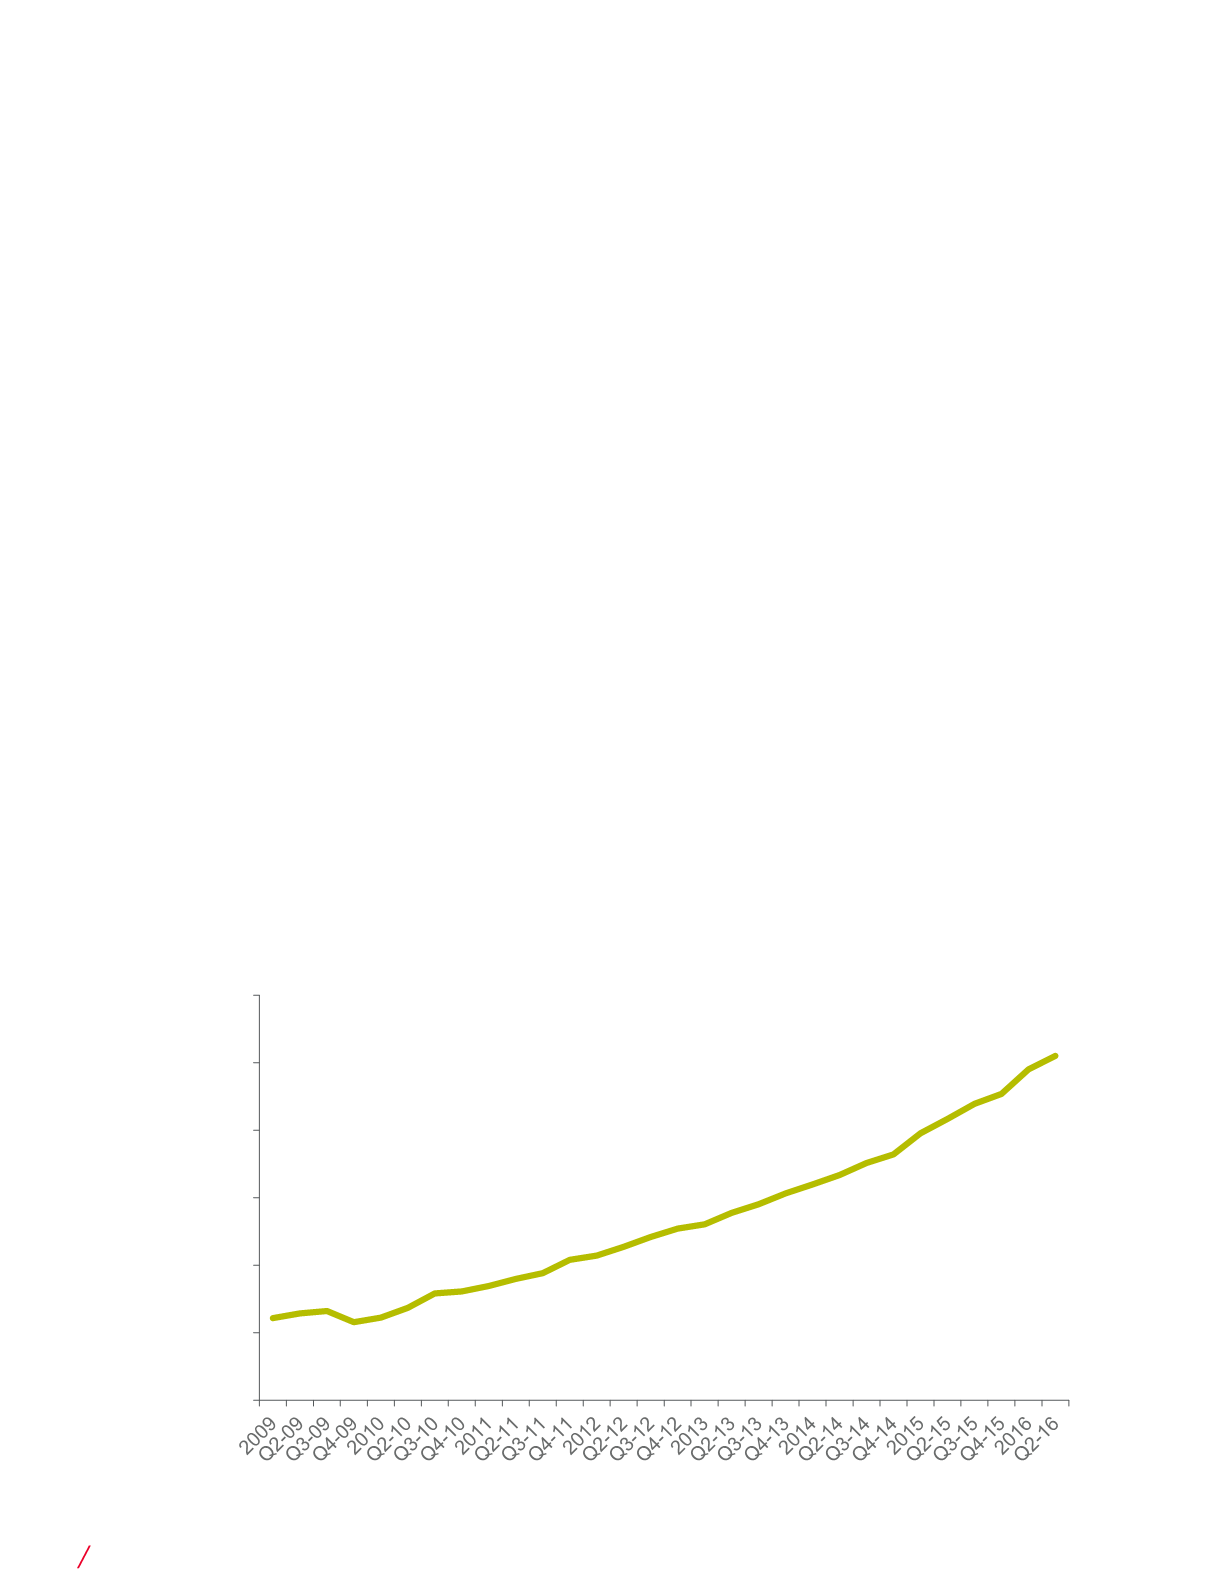
U.S. eCommerce Share of TOTAL Retail Sales
4.2%
9.5%
8.1%
2009
Q2 2016
Current eCommerce total share of U.S. retail sales,
excluding automotive and fuel sales
6
CUSHMAN & WAKEFIELD