


 7 / 70

30.0%
35.0%
40.0%
$160,000
$180,000
$200,000
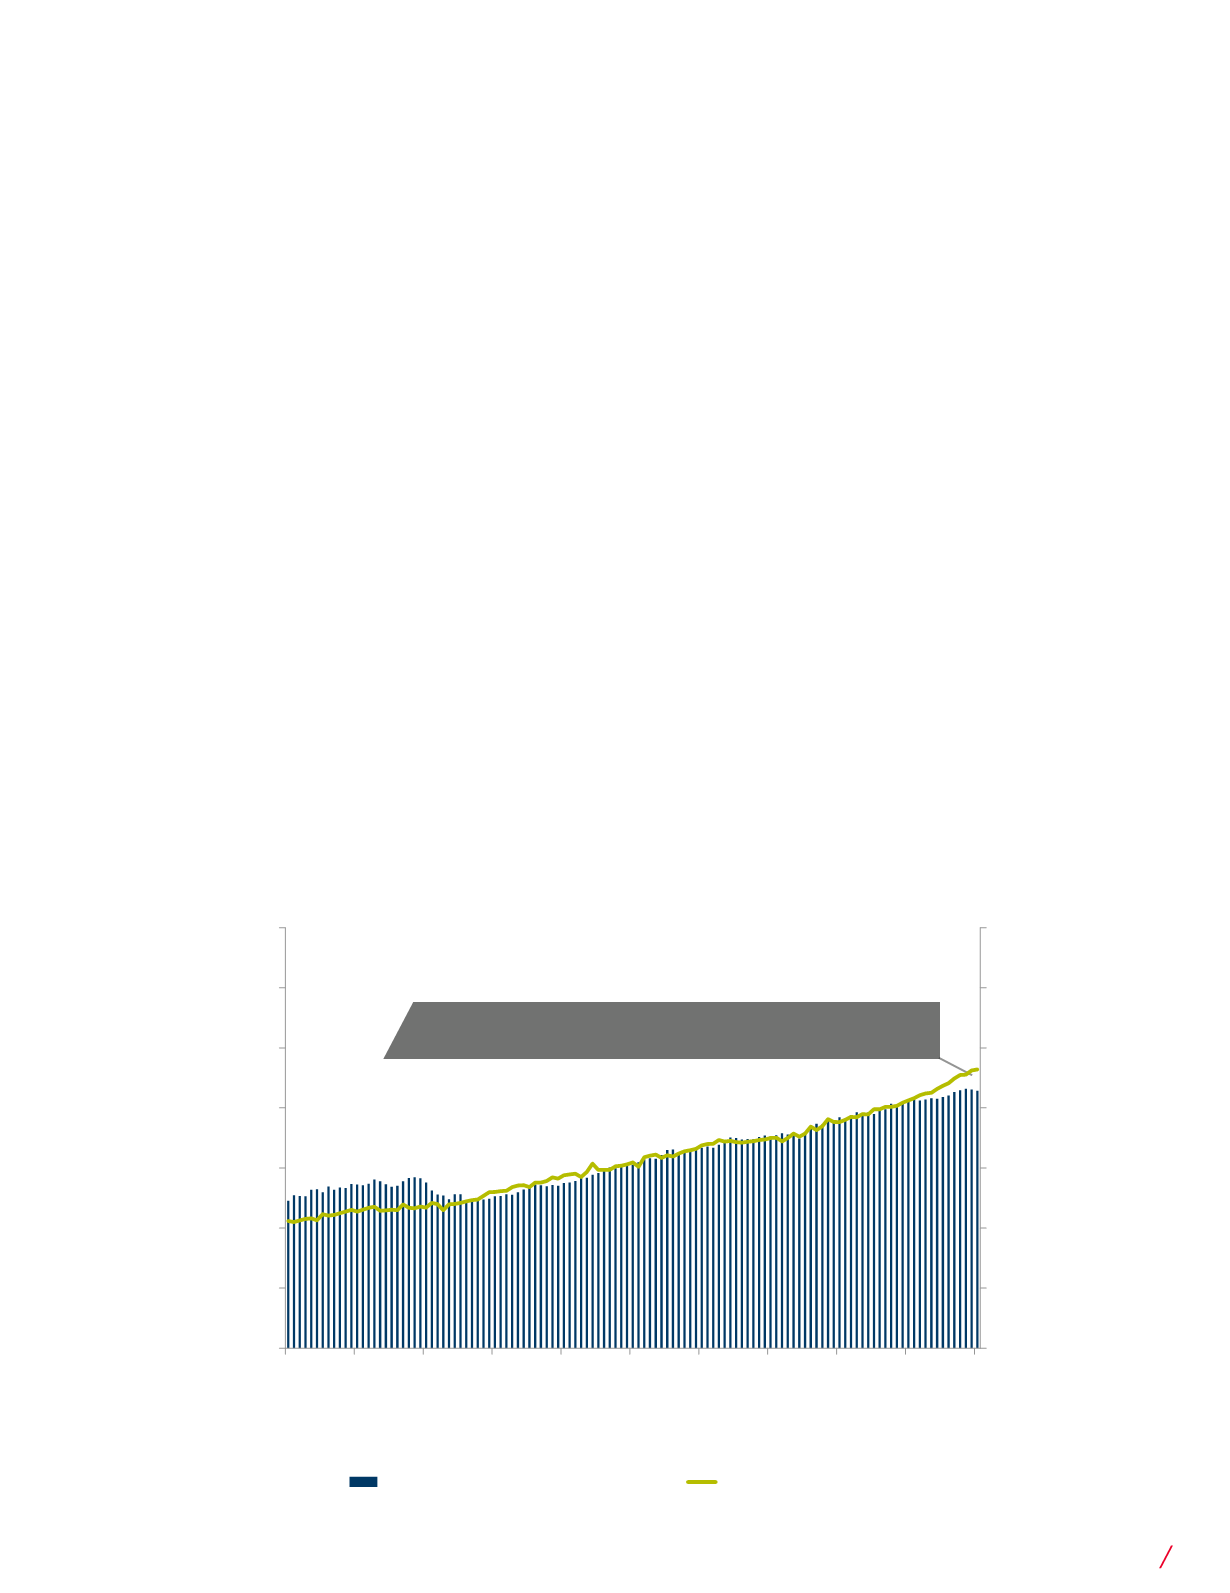
Retail Sales: GAFO, ($Mil.)
eCommerce Share
(whether from pure-play online retailers like
Amazon or bricks-and-mortar retailers
growing their omnichannel presence) have
been the primary driving force behind this
wave of consolidation. This trend is unlikely
to end any time soon.
Still, despite these challenges overall
shopping center vacancy has actually
continued to trend downward. Overall
shopping center vacancy in the U.S. was
7.4% at the end of Q3 2016, down from
7.5% three months earlier and down from
7.8% at the close of Q3 2015. The expan-
sion of food-related retail concepts, from
grocery stores to restaurants, is one of the
reasons why.
The Rise of Food Retail
There are plenty of reasons for the surging
popularity of food halls in the U.S. but let’s
start with the most basic one: Americans
are eating out more than ever before. The
Commerce Department and the U.S. De-
partment of Agriculture report on monthly
food sales in the U.S. in two categories;
food expenditures at home and food
expenditures away from home. These
essentially break out as grocery vs.
restaurant sales.
The good news for both grocery stores and
restaurant concepts is that overall numbers
have been consistently increasing since
2010 at a rate of 5.9% annually. Between
2014 and 2015 both concepts grew at a rate
Occupancy growth in the post-recession era has been
all about two factors; economics and eCommerce.
eCommerce Sales as a Percentage of GAFO are Significant
eCommerce Accounts for 28.2% of GAFO Sales
5.0%
10.0%
15.0%
20.0%
25.0%
30.0%
35.0%
40.0%
$60,000
$80,000
$100,000
$120,000
$140,000
$160,000
$180,000
$200,000
1-Aug-06
1-Aug-07
1-Aug-08
1-Aug-09
1-Aug-10
1-Aug-11
1-Aug-12
1-Aug-13
1-Aug-14
1-Aug-15
1-Aug-16
U.S. Department of Commerce
7
Food Halls of America 2016