


 8 / 70

of 3.3%, the year prior the growth rate was
3.7%. We anticipate growth in 2016 will be
close to 4.0%.
While Americans are spending more money
on food of all types, just in March 2016,
Americans spent more money dining out
than they did purchasing groceries. In
recent years the gap between grocery and
restaurant spending had been consistently
narrowing; this was the first time that “away
from home” expenditures ever surpassed “at
home” food spending. The trend has repeat-
ed itself every month since.
It is easy to understand the strong growth
that the restaurant sector has experienced.
Americans spent roughly $1 trillion on food
expenditures in 2005 and just over $1.5 trillion
in 2015. The food pie has gotten bigger.
Cushman & Wakefield has been tracking
retailer and restaurant chain growth plans
for the past decade. In 2007, restaurants
accounted for roughly 25% of all the
planned unit growth across all retail sectors
tracked. By 2010 that number had increased
to 35%. For the last three years, restaurant
concepts have consistently accounted for
50% of all the planned unit growth. Restau-
rants have, by far, been the most active
sector of the marketplace regardless of the
geography (urban or suburban) or type of
retail property type (whether freestanding
or shopping center).
Yet the restaurant industry has not been
immune from the same trend of elevated
bankruptcies that has impacted hard goods
retailers, even in 2016. The recent failures of
concepts like Buffets, Inc., Logan’s Road-
house, Garden Fresh and others stands in
stark contrast to this trend of growth. But
market saturation, not waning consumer
demand, is the culprit here. Nearly every
major restaurant chain that filed for bank-
ruptcy in 2016 has been a casual dining
player; that sector is where we are seeing the
greatest weakness as older concepts find
themselves caught between changing
FOOD HALLS OF AMERICA
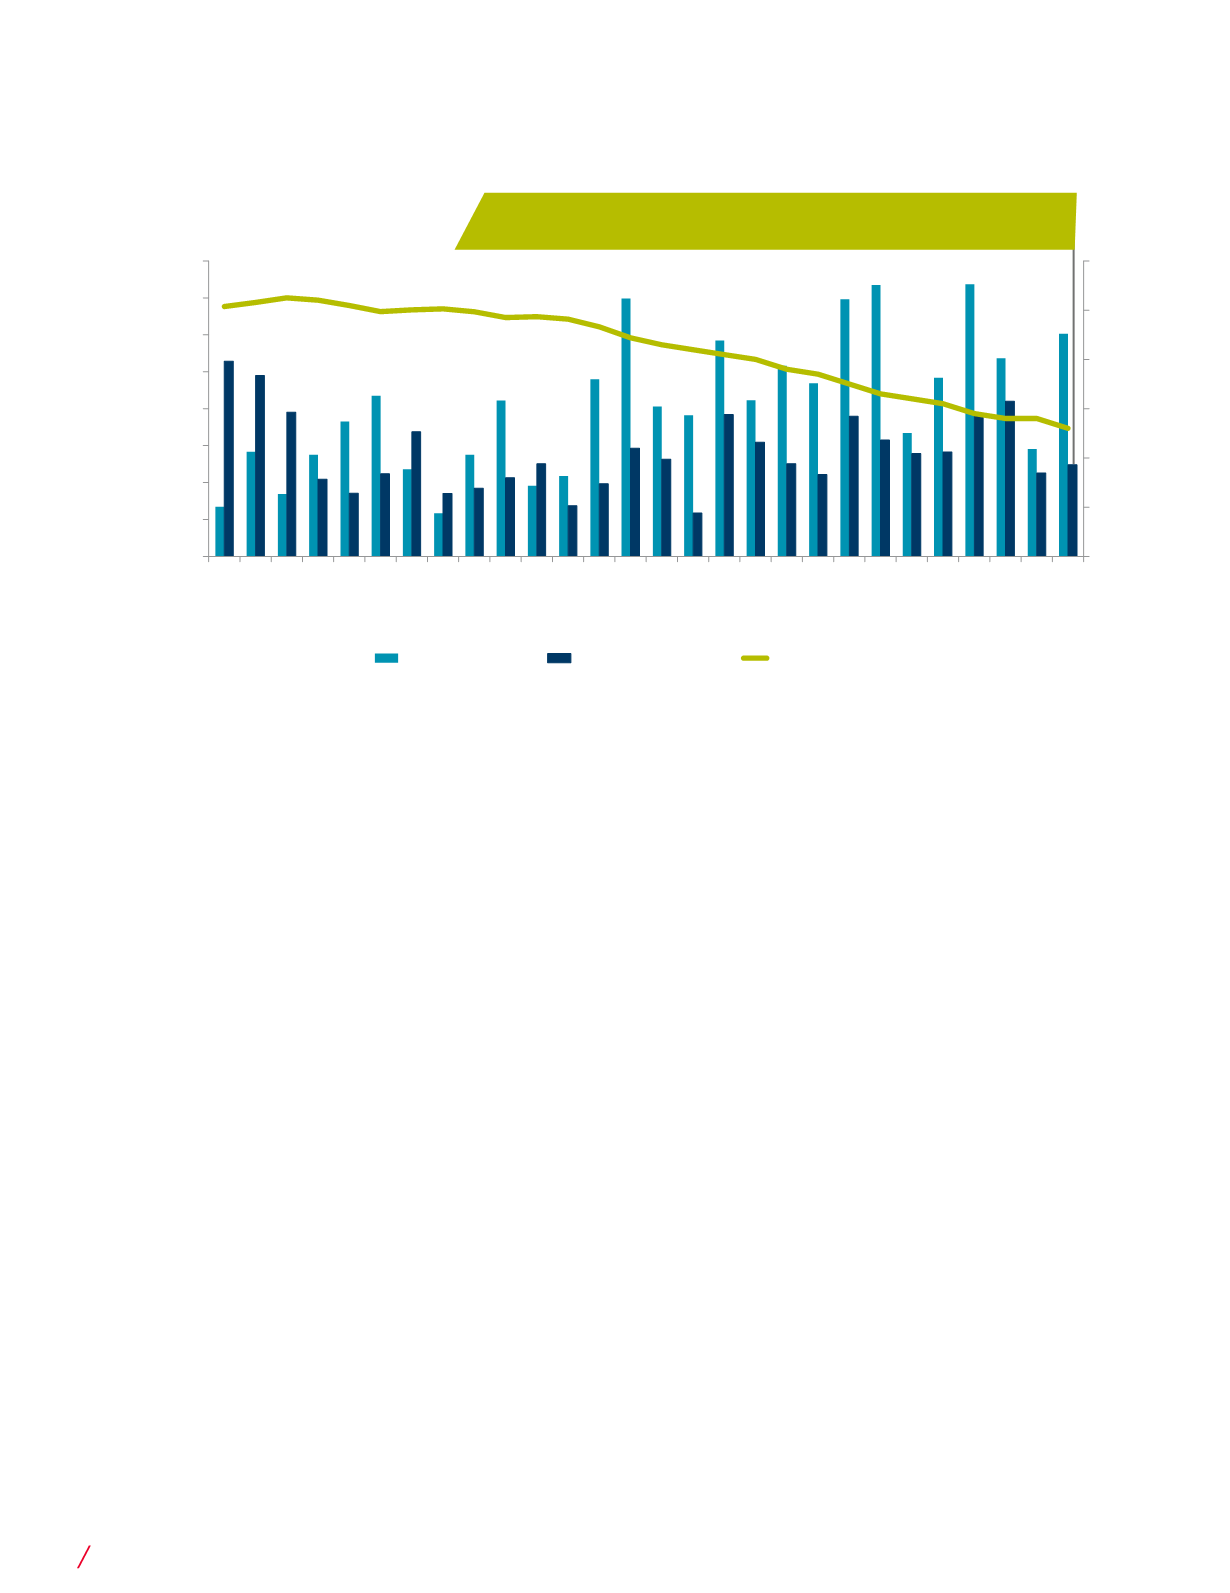
Shopping Center Vacancy is Actually Down! (For Now)
Source: Costar Group, Cushman & Wakefield Research
5%
6%
7%
8%
9%
10%
11%
0
2
4
6
8
10
12
14
16
2009 Q3
2010 Q3
2011 Q3
2012 Q3
2013 Q3
2014 Q3
2015 Q3
Million Square Feet
Net Absorption
New Construction
Overall Vacancy
8
CUSHMAN & WAKEFIELD